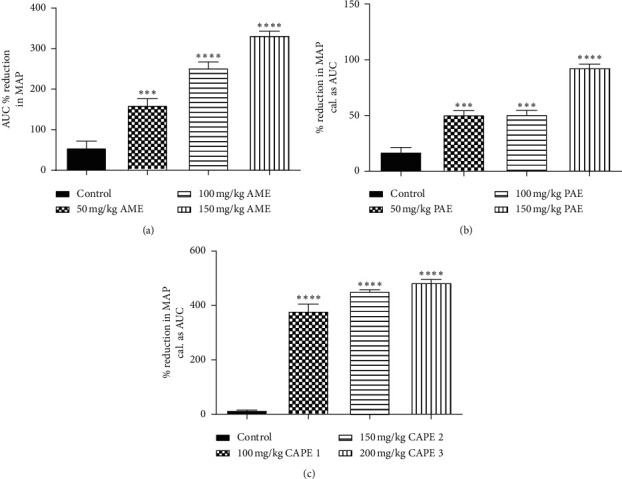
Figure 3.

Percentage reduction in mean arterial pressure (MAP) caused by (a) AME, (b) PAE, and (c) CAPE administration to SD rats within 24 hours. Values are plotted as mean ± SEM (n = 6). ∗∗∗p ≤ 0.001, compared to the control (one-way ANOVA with Dunnett's multiple comparison post hoc test). CAPE 1, CAPE 2, and CAPE 3 are combinations of AME and PAE in the ratios 1 : 1, 1 : 2, and 1 : 3, respectively.
