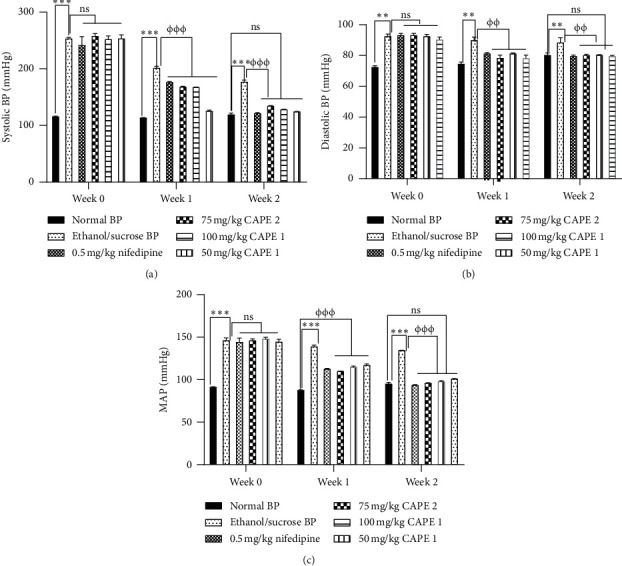
Figure 4.

Effect of various concentrations of CAPE 1, CAPE 2, and nifedipine on (a) systolic blood pressure (SBP), (b) diastolic pressure (DBP), and (c) mean arterial pressure (MAP) in ethanol/sucrose-induced hypertension. Values are plotted as mean ± SEM. ∗∗∗p ≤ 0.001 compared to the normal control group and also φφφp ≤ 0.001 compared to the negative control group; one-way ANOVA with Dunnett's multiple comparison post hoc test.
