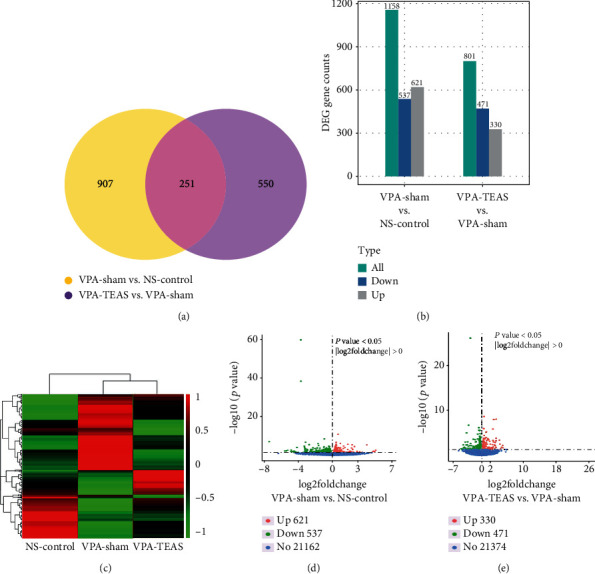
Figure 4.

Differential gene analysis of the hypothalamus. (a) The Venn chart of differential gene among NS-control, VPA-sham, and VPA-TEAS group (n = 3 for each group). (b) Distribution of differential genes of NS-control, VPA-sham, and VPA-TEAS group. (c) Clustering of NS-control, VPA-sham, and VPA-TEAS group in heat map diagram. (d) Volcano plot of differential genes between VPA-sham and NS-control. (e) Volcano plot of differential genes between VPA-TEAS and VPA-sham.
