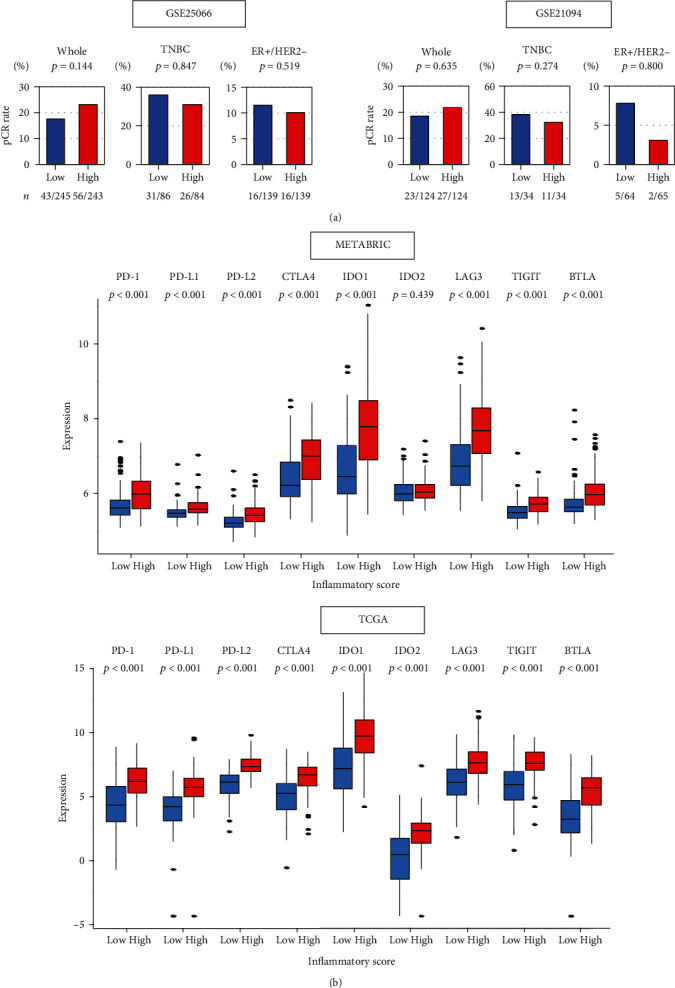
Figure 5.

Relationships between the inflammatory score and neoadjuvant chemotherapy or expression of immune checkpoint molecules. (a) Percentage of achievement of pathological complete response (pCR) between low (blue bar) and high (red bar) inflammatory score in whole, TNBC and ER+/HER2- in the GSE25066 (n = 467) and GSE20194 (n = 248) breast cancer cohorts that underwent neoadjuvant chemotherapy. The number of patients who achieved pCR is shown below the plots. Fisher's exact test is used to compare pCR rates between two groups. (b) Comparison of low (blue) and high (red) inflammatory score groups in gene expression of immune checkpoint molecules (log2 transcripts per million) in METABRIC and TCGA cohorts. Inflammatory score in each cohort was divided into low and high groups by the median values. Tukey-type boxplots show median and interquartile level values, and the ANOVA test is used to calculate p values. BTLA: B- and T-lymphocyte attenuator; CTLA4: cytotoxic T-lymphocyte-associated protein 4; IDO1/2: indoleamine dioxygenase 1/2; LAG3: lymphocyte activation gene 3; PD-1: programmed death-1; PD-L1: programmed death ligand 1; TIGIT: tyrosine-based inhibitory motif domain.
