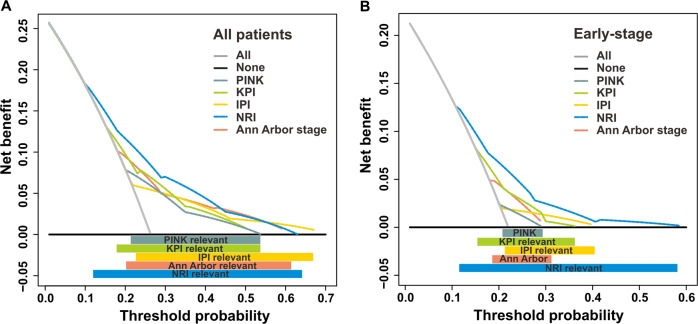
Fig. 4. Time-dependent decision curve analysis.
Time-dependent decision curve analysis of risk models predicting the 3-year mortality by any cause for all-stage (a) and early-stage (b) patients in the validation cohort. The threshold probability represented the 3-year risk of mortality by any cause based on each prognostic model for recommending clinical intervention. The threshold defines the weight w for false-positive (FP, treat while patient survived) vs. true-positive (TP, treat a patient who died) classifications. The net benefit (NB) balanced the risk of real 3-year mortality with the potential harms of unnecessary intervention (including decision of treatment, work-up, or follow-up) for false prediction and was calculated as the true-positive rate minus the weighted false-positive rate. The clinical usefulness of a prediction model can be summarized as: NB = (TP − w FP)/N, where N is the total number of patients. Solid black line: Assume no patients need receive clinical intervention (no patients died), net benefit is zero (no true-positive and no false-positive classification). Gray line: Assume all patients need receive clinical intervention (all died). Dotted color lines: Patients received clinical intervention if predictions exceeded a threshold, with 3-year mortality risk predictions based on different prognostic models. In general, the prognostic model with the highest net benefit at any threshold is deemed to have the highest clinical application value.

