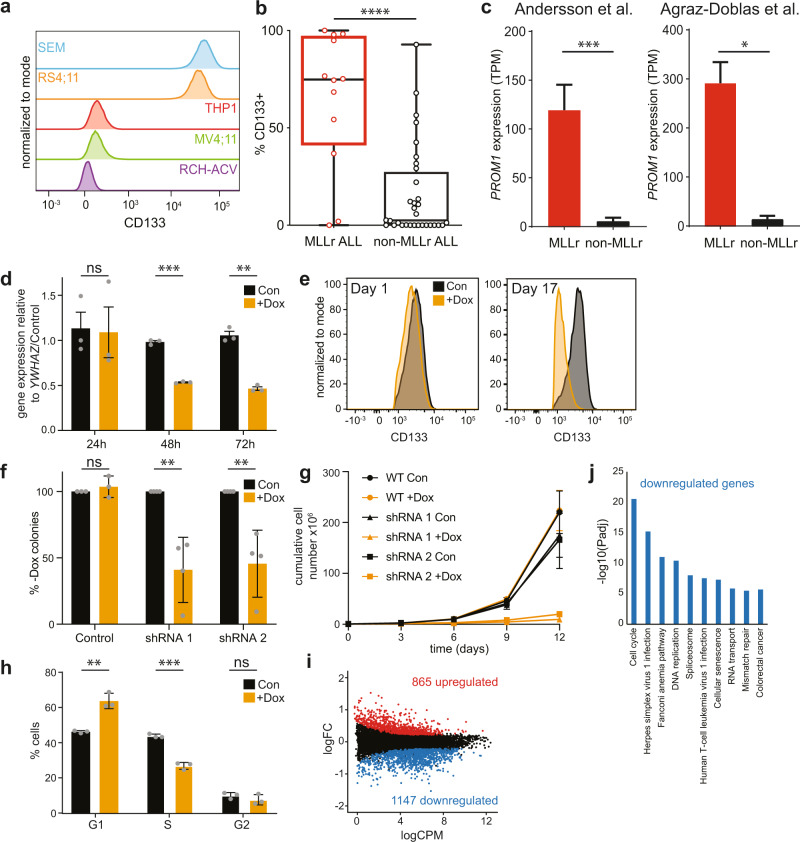
Fig. 1. CD133 expression is essential for MLL-AF4 ALL cell growth.
a Flow cytometry data showing CD133+ expression in different leukemia cell lines. Representative of two biological replicates. b Flow cytometry data showing the percentage of CD133+ cells in blast populations from 12 MLLr and 32 non-MLLr infant and childhood ALL patients. Box represents median and interquartile range; whiskers show minimum and maximum values, ****p < 0.0001. Mean values: 64.9% ± 10.2 s.e.m. and 15.7% ± 4.2 s.e.m.; median: 74.9% and 2.5% for MLLr and non-MLLr blasts, respectively. c Expression of PROM1 by RNA-seq from two independent published datasets Left: expression of PROM1 in MLL-AF4 ALL patients compared with non-MLLr ALL patient blasts from Ref. [32], ***p < 0.001; right: expression of PROM1 in MLLr ALL patients compared with non-MLLr ALL patient blasts from Ref. [33], *p < 0.05. d qRT-PCR of PROM1 in untreated control (black) and doxycycline-treated (orange) PROM1 shRNA 1 SEM cells after 24, 48, and 72 h. Error bars represent s.e.m. of three biological replicates, ***p < 0.001, **p < 0.01, ns = no significant difference. e Flow cytometry analysis showing CD133 level in PROM1 shRNA 1 SEM cell line in control (black) and induced (orange) conditions at day 1 (24 h doxycycline treatment) and day 17 (following colony assay). Histograms are representative of three replicates. f Colony assay showing percentage of colonies formed in control and PROM1 shRNA 1 and 2 SEM cell lines in the presence of 0.5 µg/ml doxycycline (+Dox) compared with uninduced control (Con = −Dox). Error bars represent s.d. of three (control) or four (shRNA) biological replicates, **p < 0.01, ns = no significant difference. g Growth curve showing cumulative cell number for control (circles) and PROM1 shRNA 1 (triangles) and 2 (squares) SEM cell lines grown in the presence (+Dox, orange) or absence (Con, black) of 0.5 µg/ml doxycycline. Cells were split into fresh medium every 3 days. Error bars represent s.e.m. of three biological replicates. h Cell cycle analysis using flow cytometry in control (black) and 72 h post induction (+Dox, orange) of PROM1 shRNA 1 cell line. Error bars represent s.e.m. from three biological replicates, ***p < 0.001, **p < 0.01, ns = no significant difference. i MA plot showing differentially expressed genes from RNA-seq 72 h post induction of PROM1 shRNA 1. Statistically significant differences (865 upregulated: red; 1147 downregulated: blue; and 10,385 unchanged: black) from three biological replicates, FDR < 0.05. j KEGG analysis of significantly downregulated genes from RNA-seq analysis, displaying ten most enriched processes.

