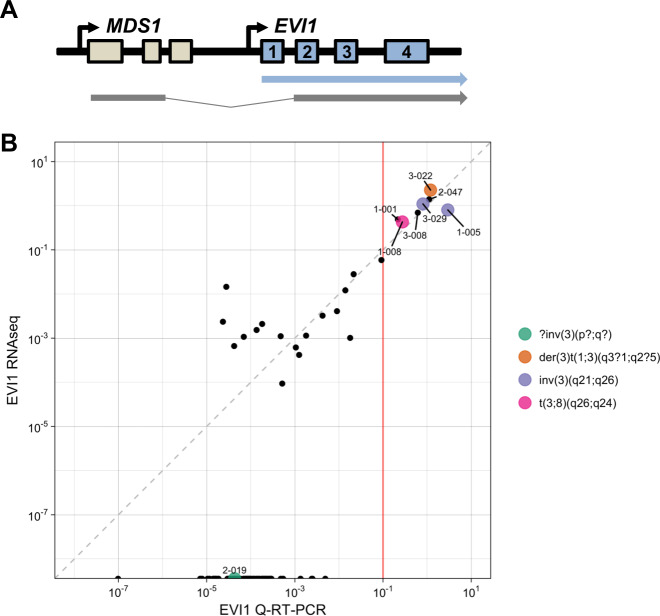
Fig. 5. Detection of EVI1 overexpression.
a Schematic representation of two mRNA transcripts from the MECOM locus on chromosome 3. One transcript contains exon 1–2 of MDS1 fused to exon 2–15 of EVI1 (MDS1-EVI1 transcript), whereas the other transcript contains exon 1–15 of EVI1 (EVI1 transcript). b Comparison of EVI1 expression by RNAseq and quantitative RT-PCR. X-axis: Expression of the first exon of EVI1 normalized for expression of the PBGD housekeeping gene by quantitative RT-PCR (log2 EVI1/PBGD). Y-axis: Sum of base coverage of the first exon of EVI1 per kb transcript and one million mapped reads (log2 BPKM) by RNAseq.

