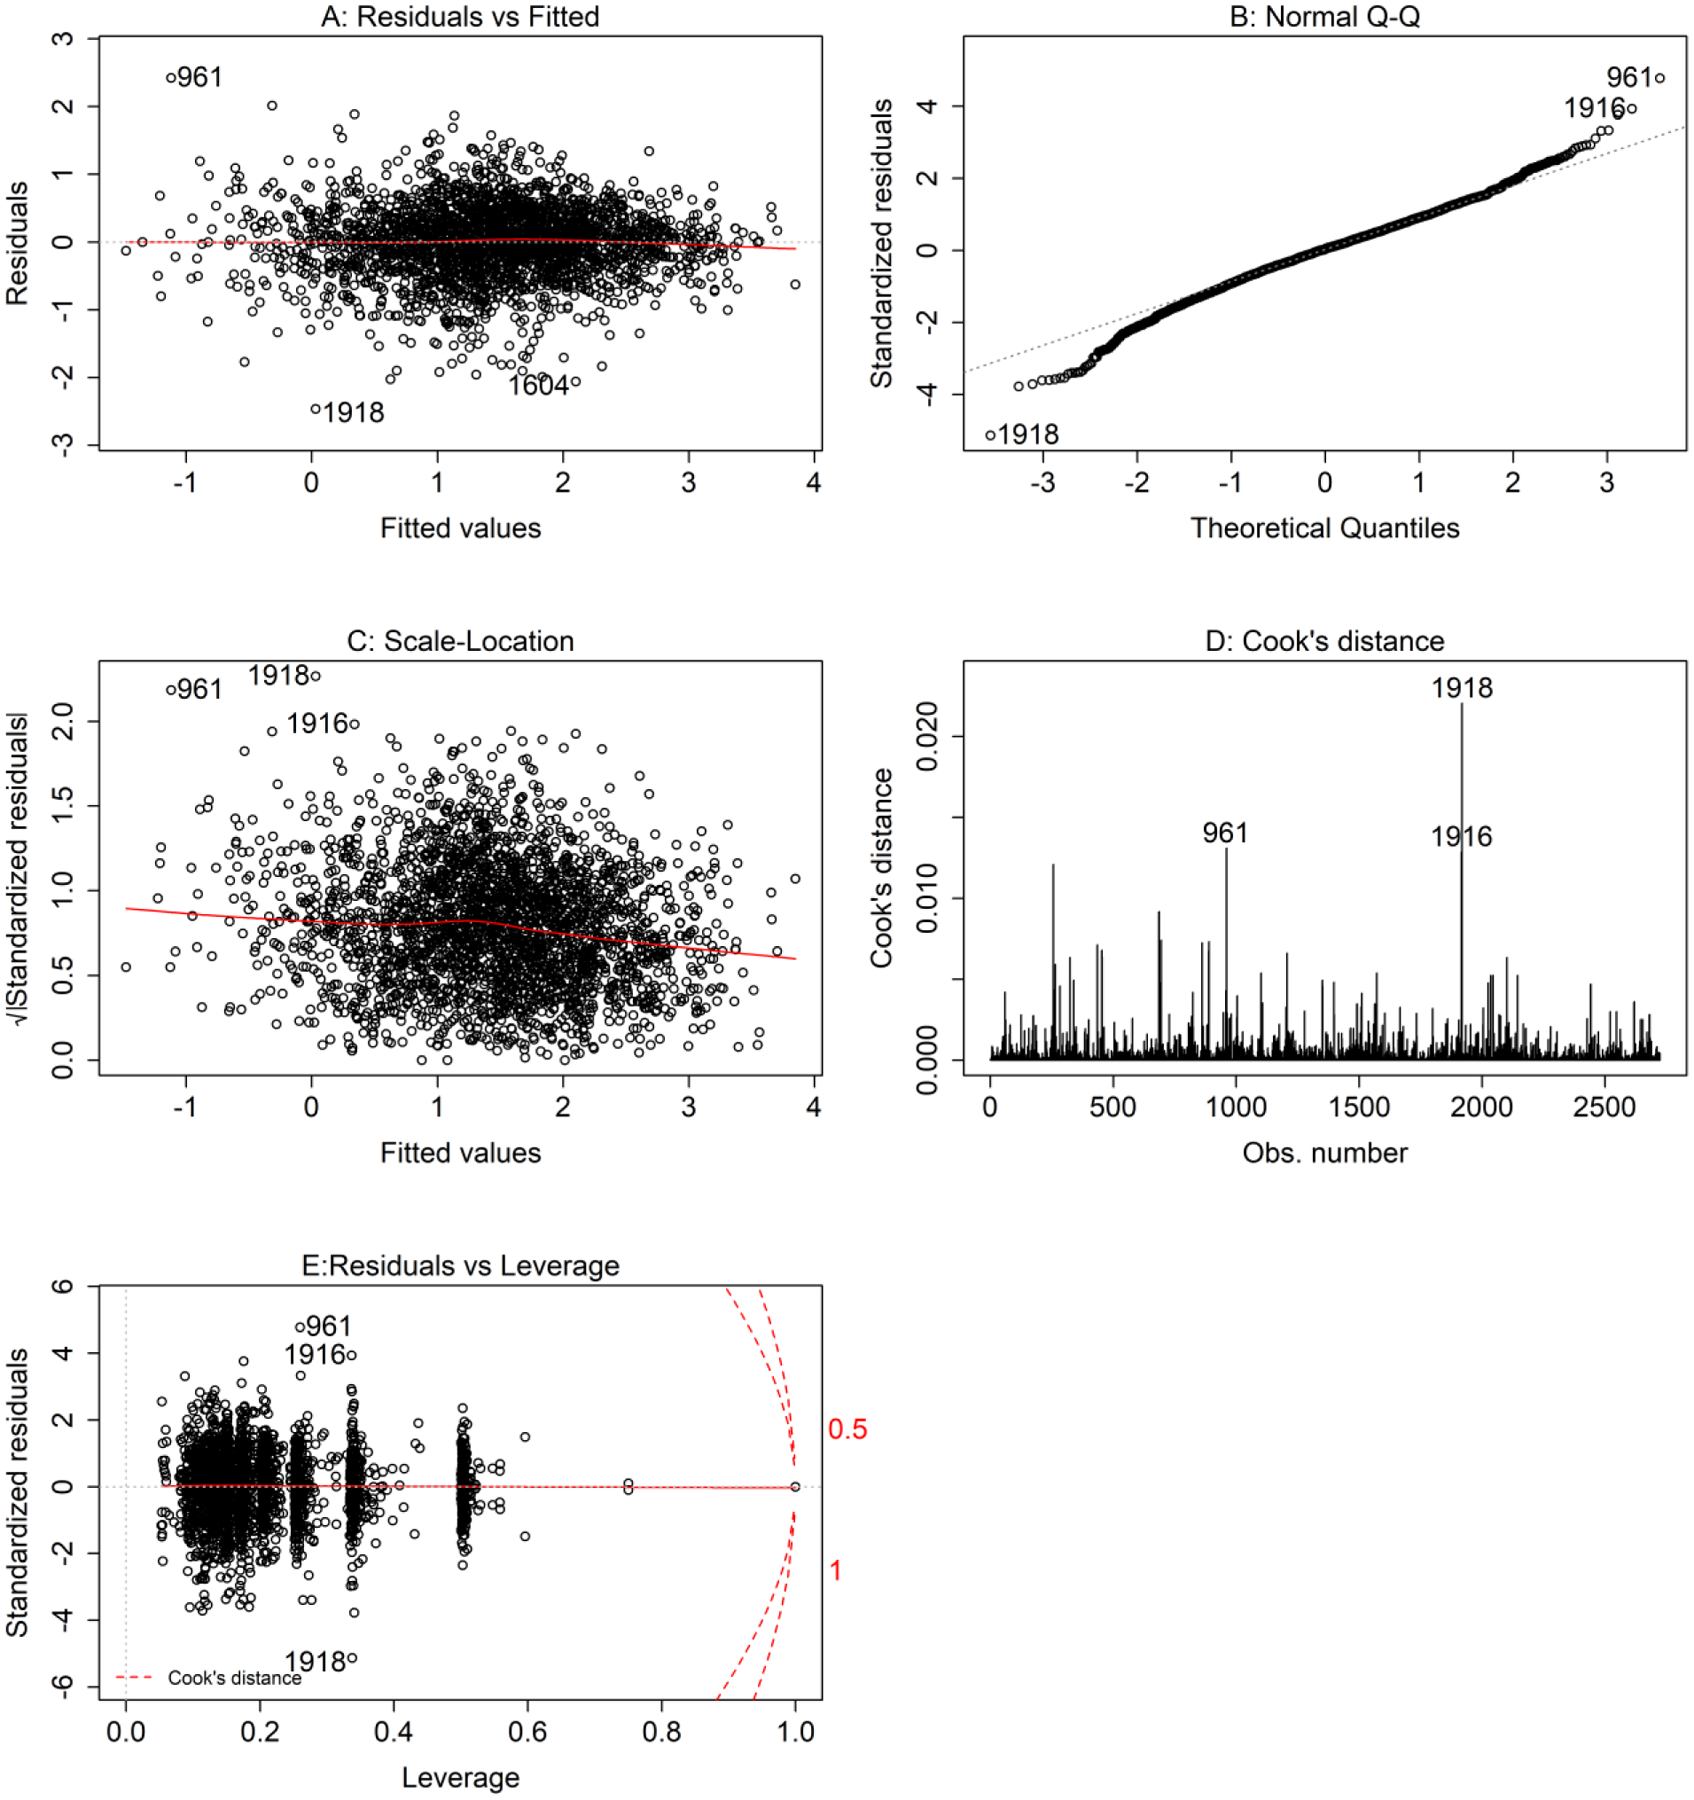
Figure 3. MLR Regression Diagnostic Plots.

Standard diagnostic plots to evaluate the residuals for the MLR model of the full dataset. (A) is the Residuals vs Fitted plot; (B) is the Normal Q-Q plot; (C) is the Scale-Location plot; (D) is the Cook’s distance plot; (E) is the Residuals vs Leverage plot. Potential outliers are labeled by their observation number (961, 1916, 1918) in the dataset.
