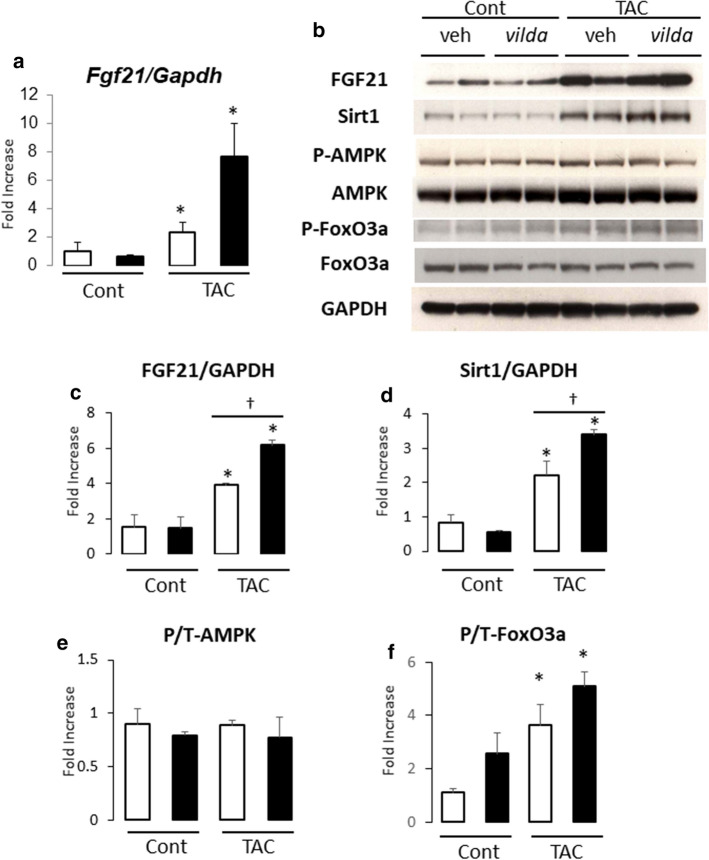
Fig. 3.
Vilda increased cardiac FGF21 expression levels in non-diabetic mouse heart with TAC. Open bar, vehicle-treated; closed bar, vilda-treated. a Myocardial FGF21 mRNA expression by real-time RT-PCR. b Representative western blot of mouse heart. c–f Summarized protein expression data for FGF21 (c), Sirt1 (d), phosphorylation levels of AMPK (e), and FoxO3a (f) estimated by the ratio of phosphorylated protein and total protein intensities. N = 4 for each experiment. Statistical analysis was performed unpaired two-tailed Student’s t test with Welch’s correction. *P < 0.05 vs control. †P < 0.05 vs vehicle-treated group

