FIGURE 2.

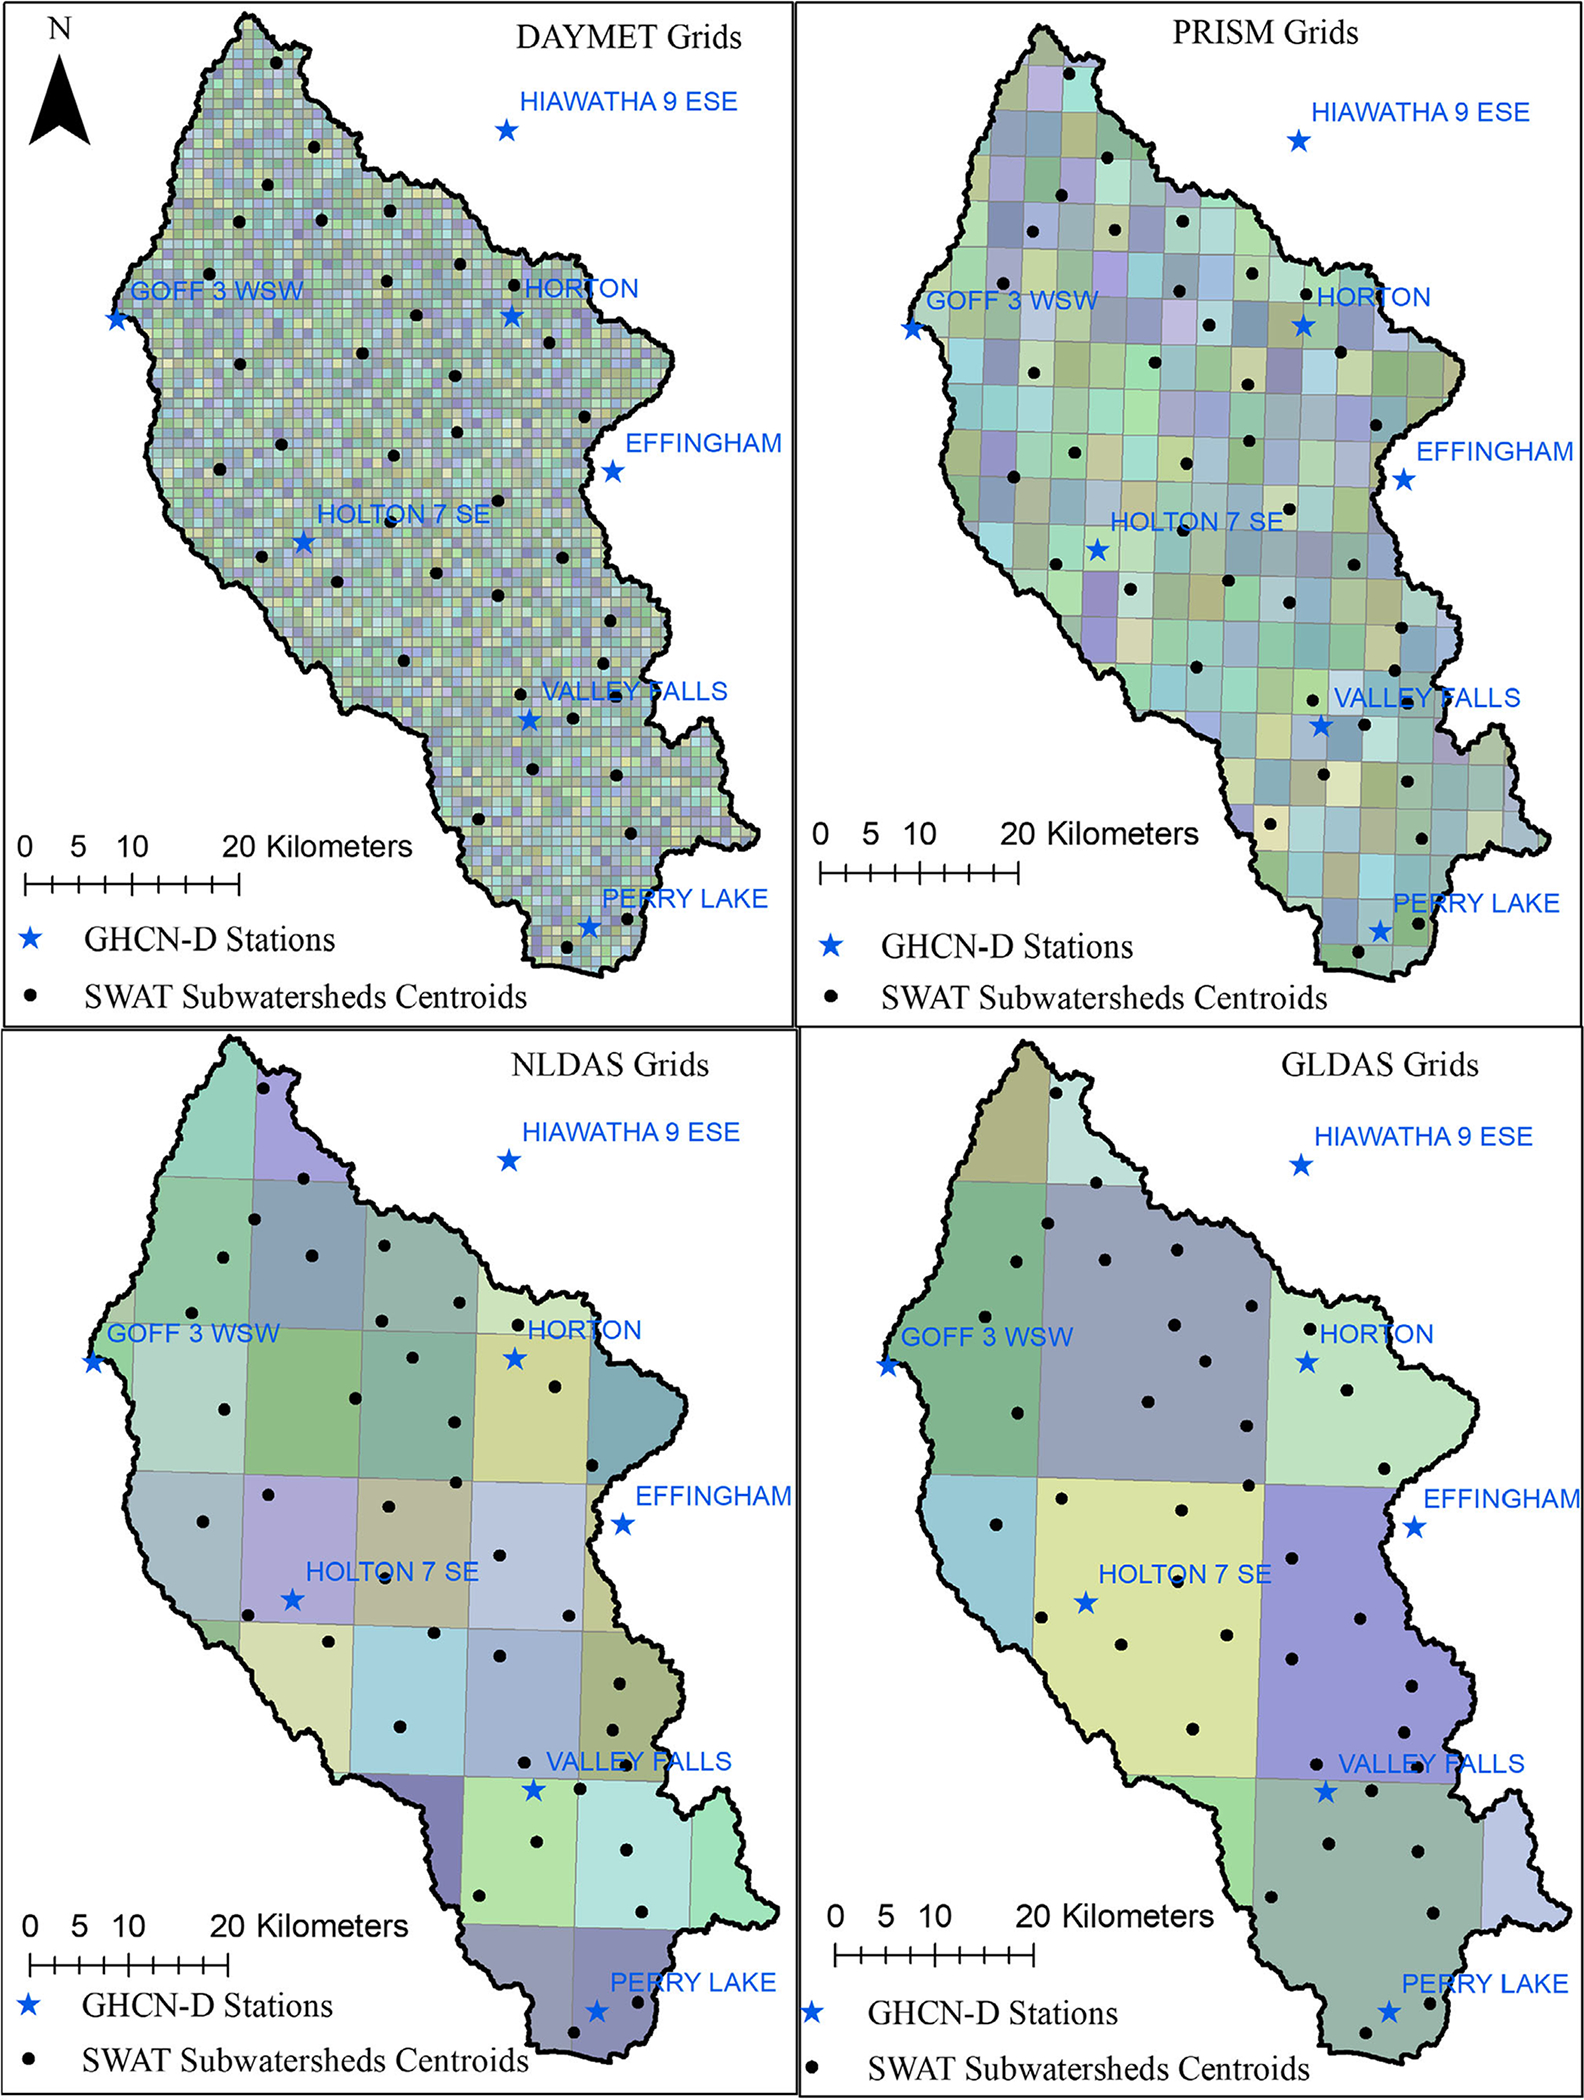
Spatial resolution of precipitation data sources by spatial grids with centroid points of subwatersheds (Note: boundaries and labels of subwatersheds are shown in Figure 1). Figure’s grid illustration is based on (Golden et al. 2010).

Spatial resolution of precipitation data sources by spatial grids with centroid points of subwatersheds (Note: boundaries and labels of subwatersheds are shown in Figure 1). Figure’s grid illustration is based on (Golden et al. 2010).