FIGURE 3.

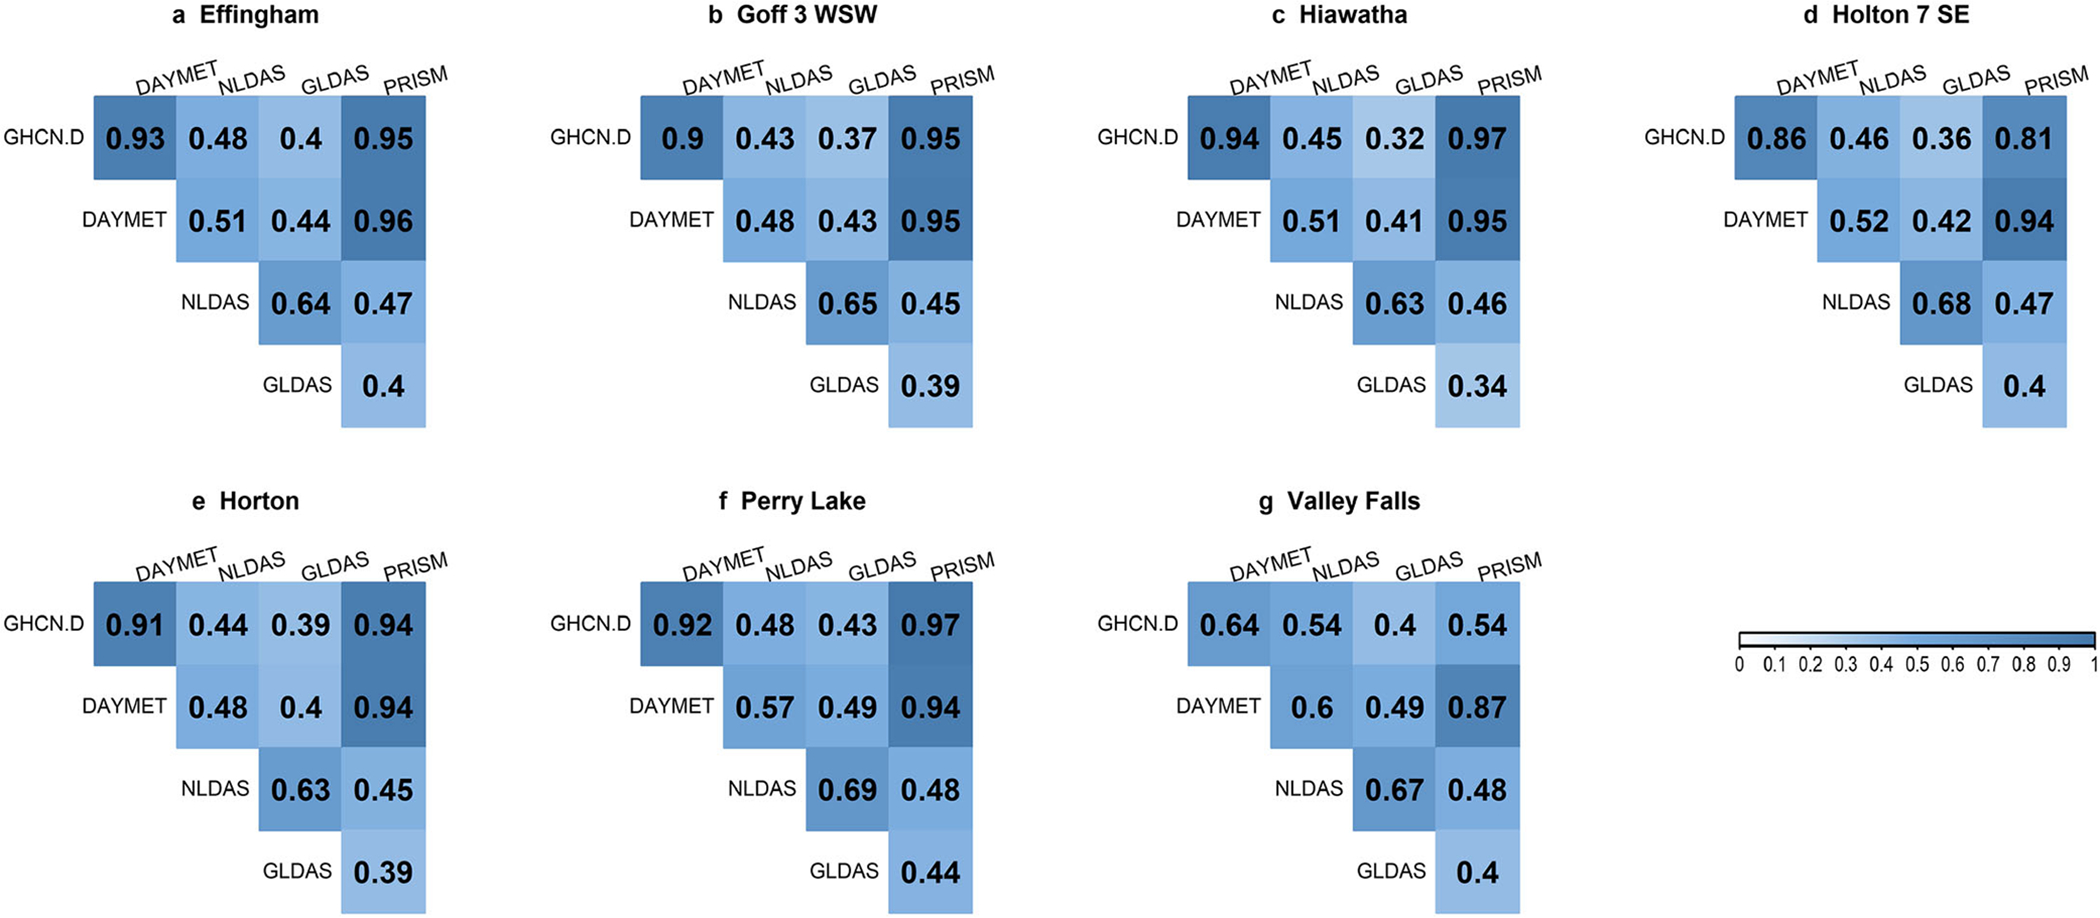
Correlogram of the precipitation correlation matrix for each station (a–g). Positive correlations at significance level = 0.05 are displayed in blue. Color intensity and size are proportional to the correlation coefficients.

Correlogram of the precipitation correlation matrix for each station (a–g). Positive correlations at significance level = 0.05 are displayed in blue. Color intensity and size are proportional to the correlation coefficients.