FIGURE 4.

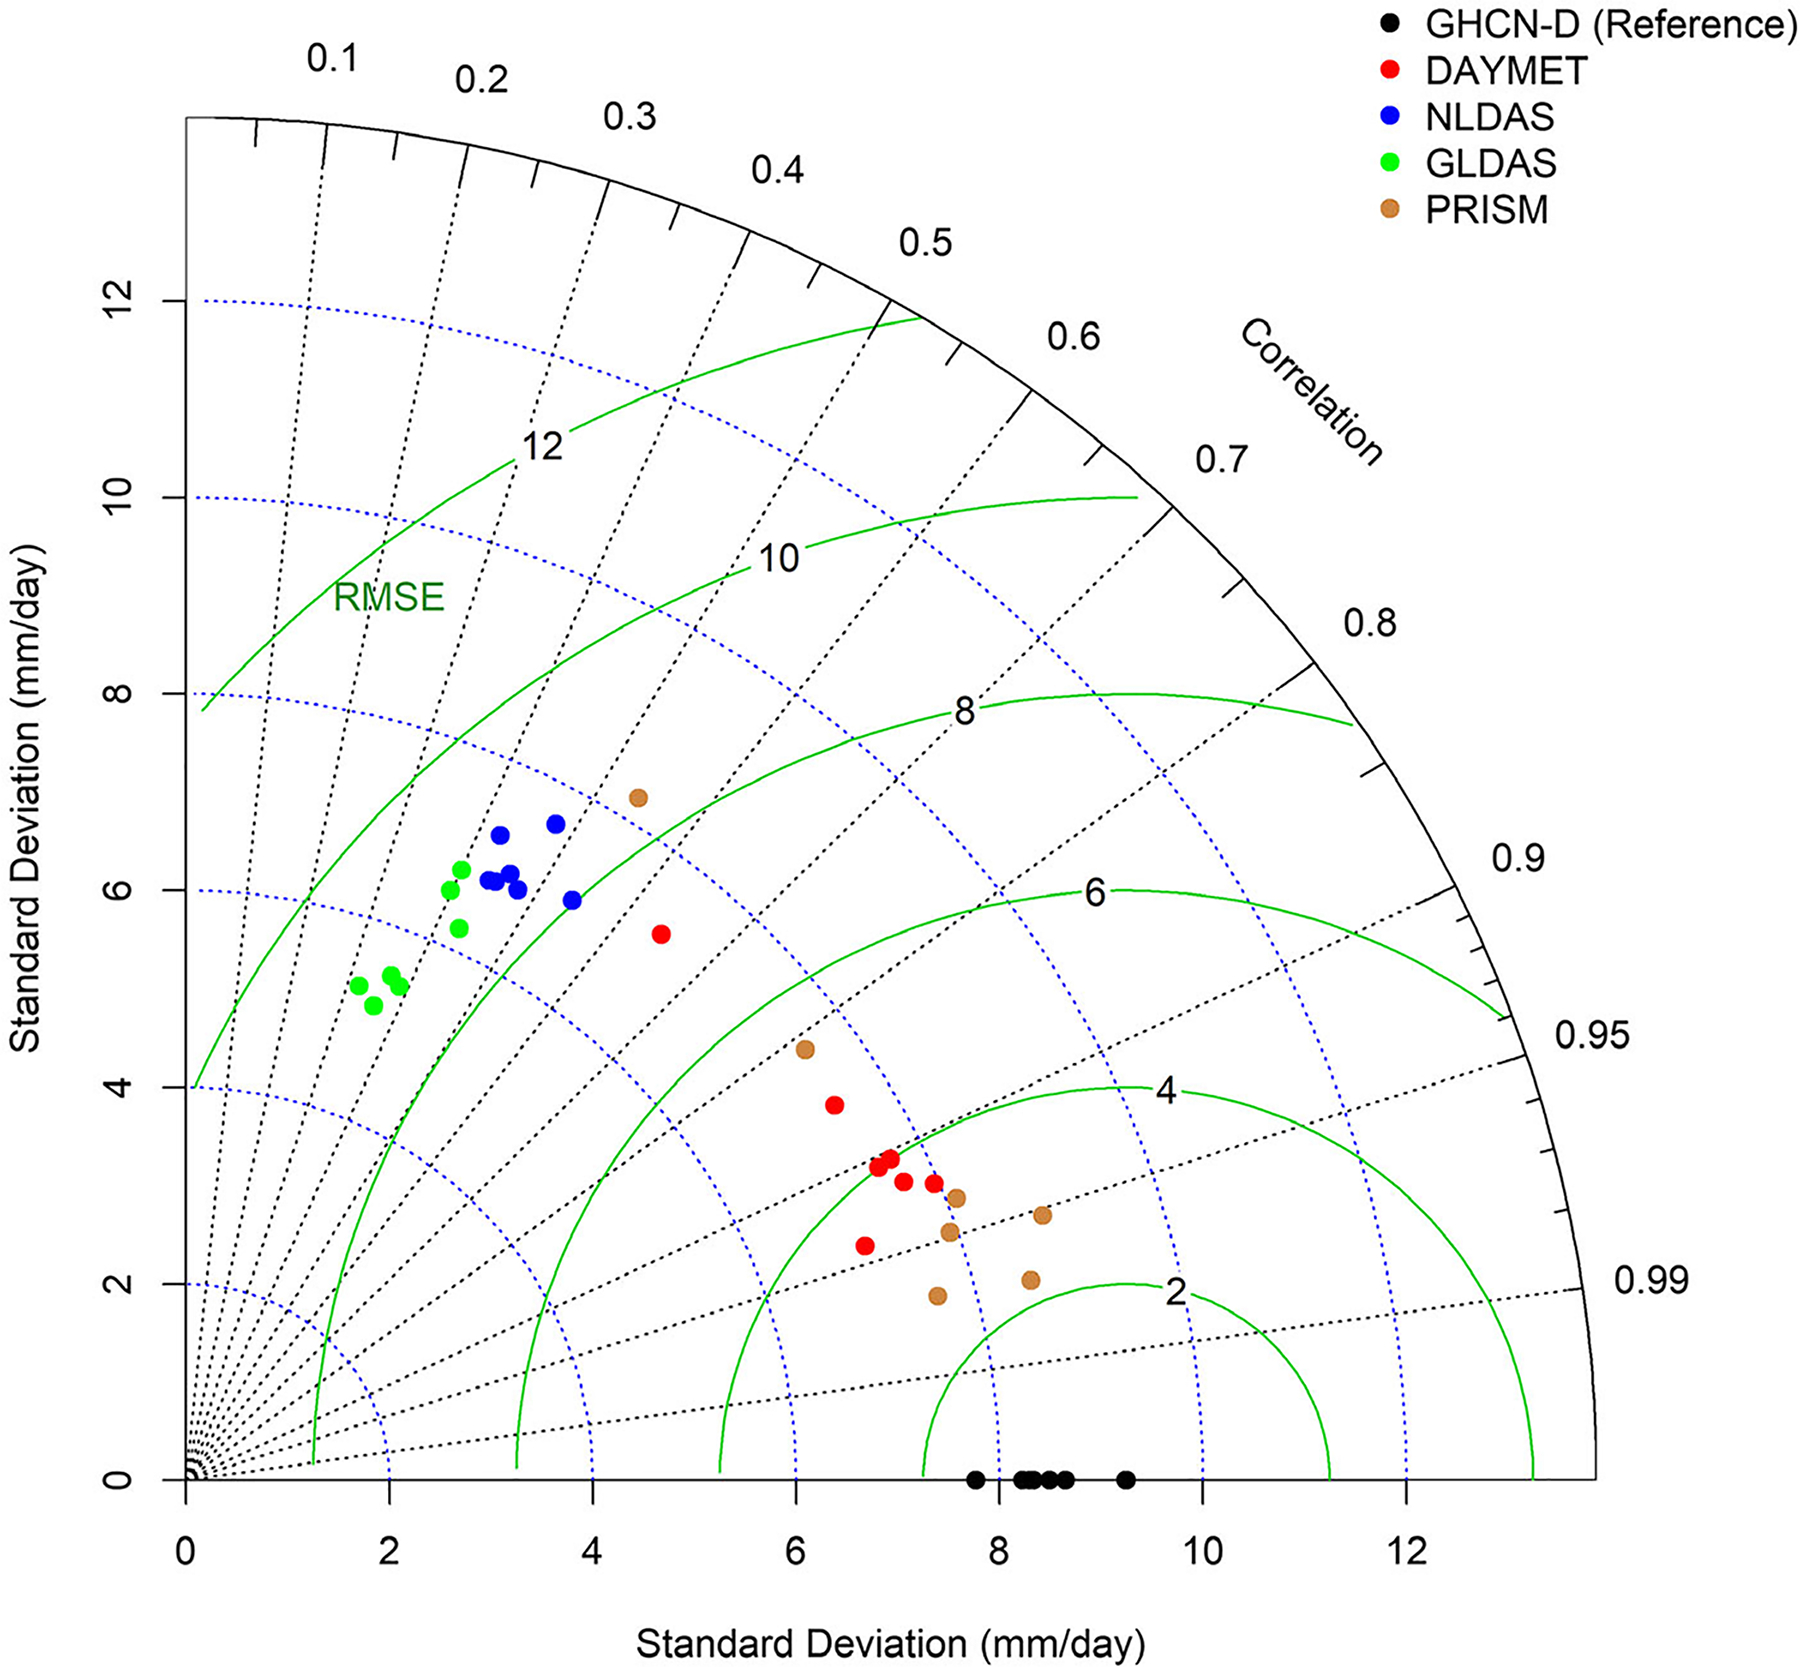
Taylor diagram showing the ability of precipitation datasets to represent GHCN-D based on daily precipitation (2001–2013).

Taylor diagram showing the ability of precipitation datasets to represent GHCN-D based on daily precipitation (2001–2013).