
FIGURE 5.
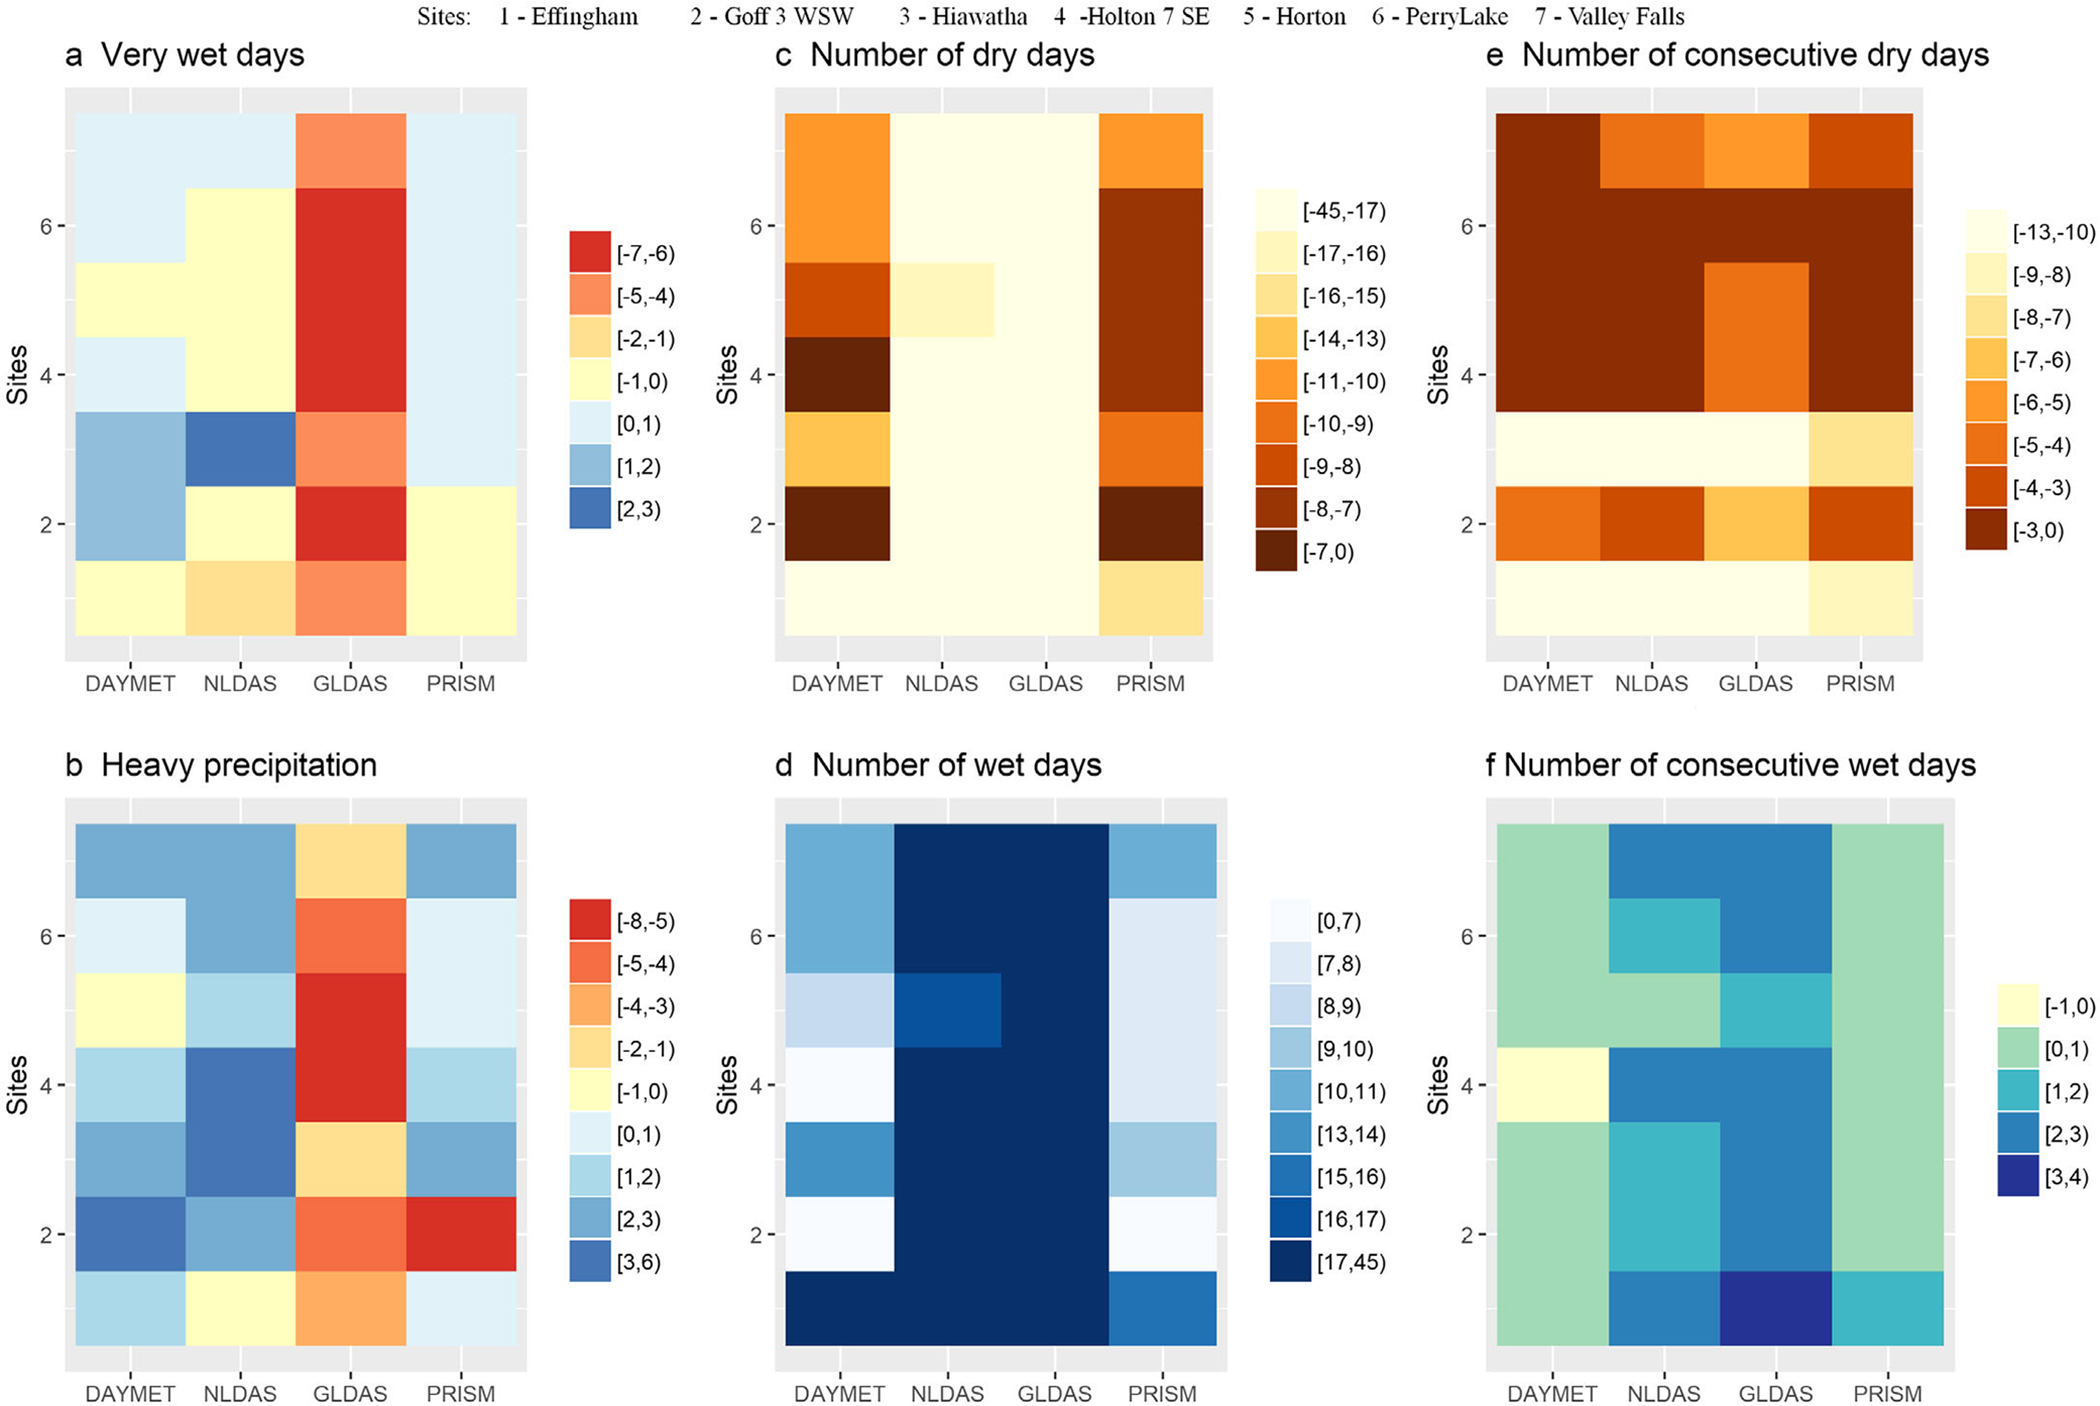
Mean bias of precipitation indices (a–f) for stations and precipitation source. These values are calculated compared to observed values (GHCN-D). Note: Positive values show overprediction and negative values show underprediction compared to GHCN-D.