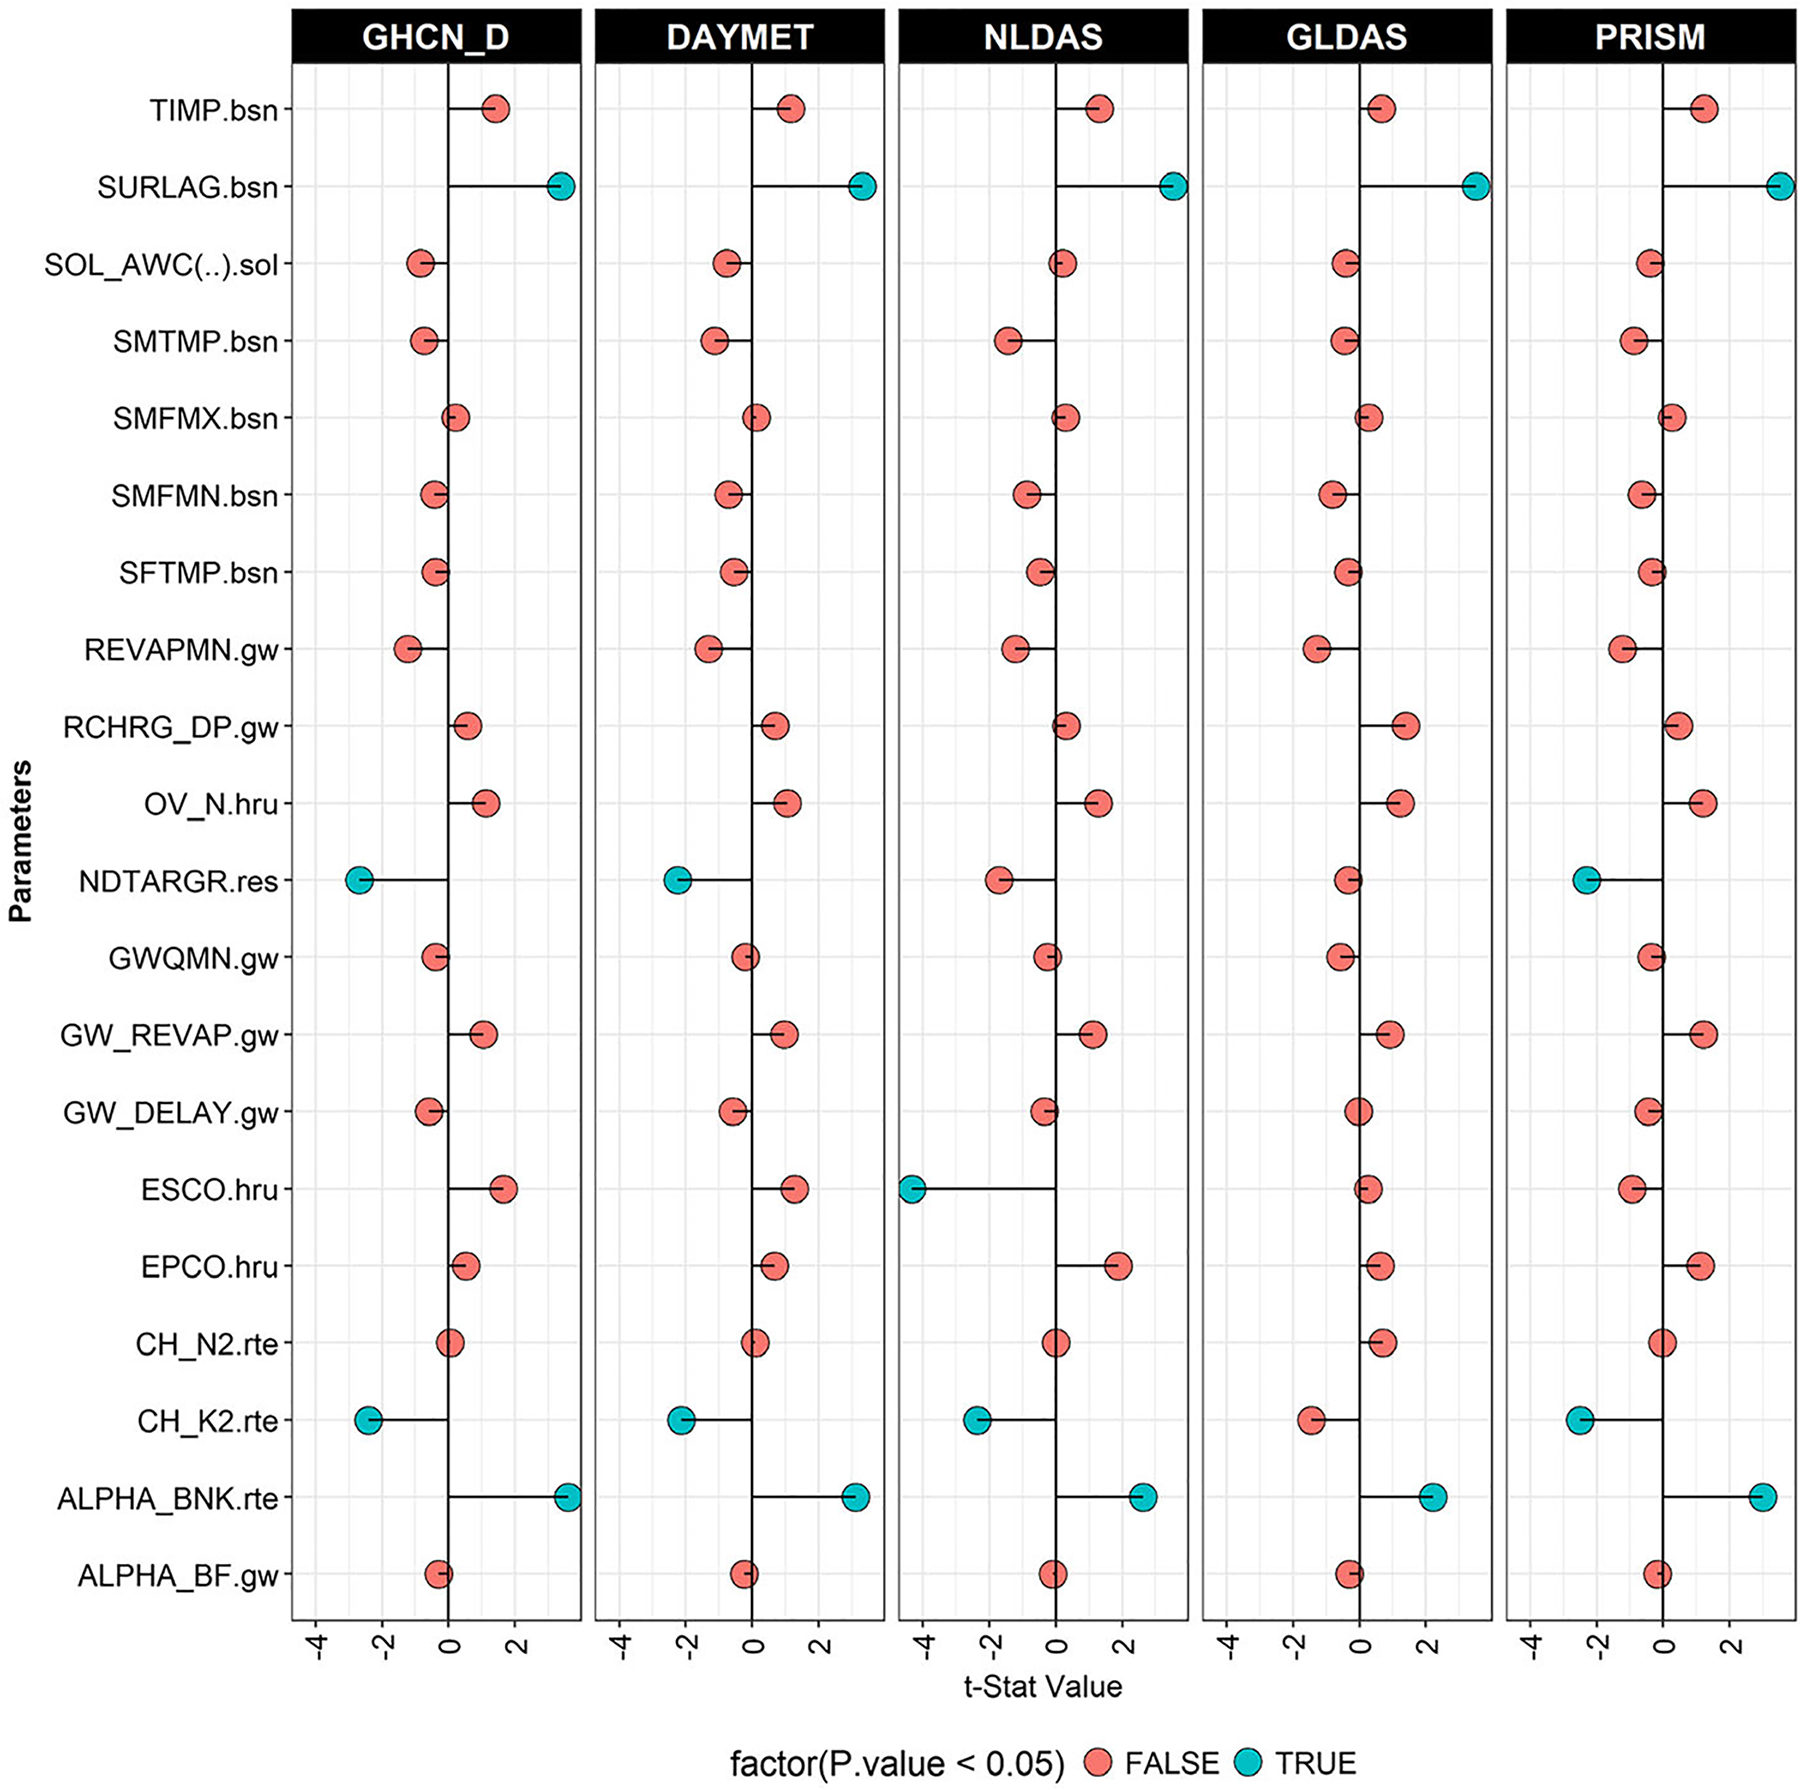
FIGURE 6.

Sensitivity of parameters during calibration period. The highest sensitive parameter, CN2 was removed from the plot to identify the outlying observation. The CN t-stat ranges from −11.1 to −19.6. The lowest negative value was observed with GLDAS and the highest was in NLDAS. DAYMET, GHCN-D, and PRISM had −12.8, −13.9, and −16.3, respectively. Note: True means statistically significant and false means not significant based on p-value of 0.05.
