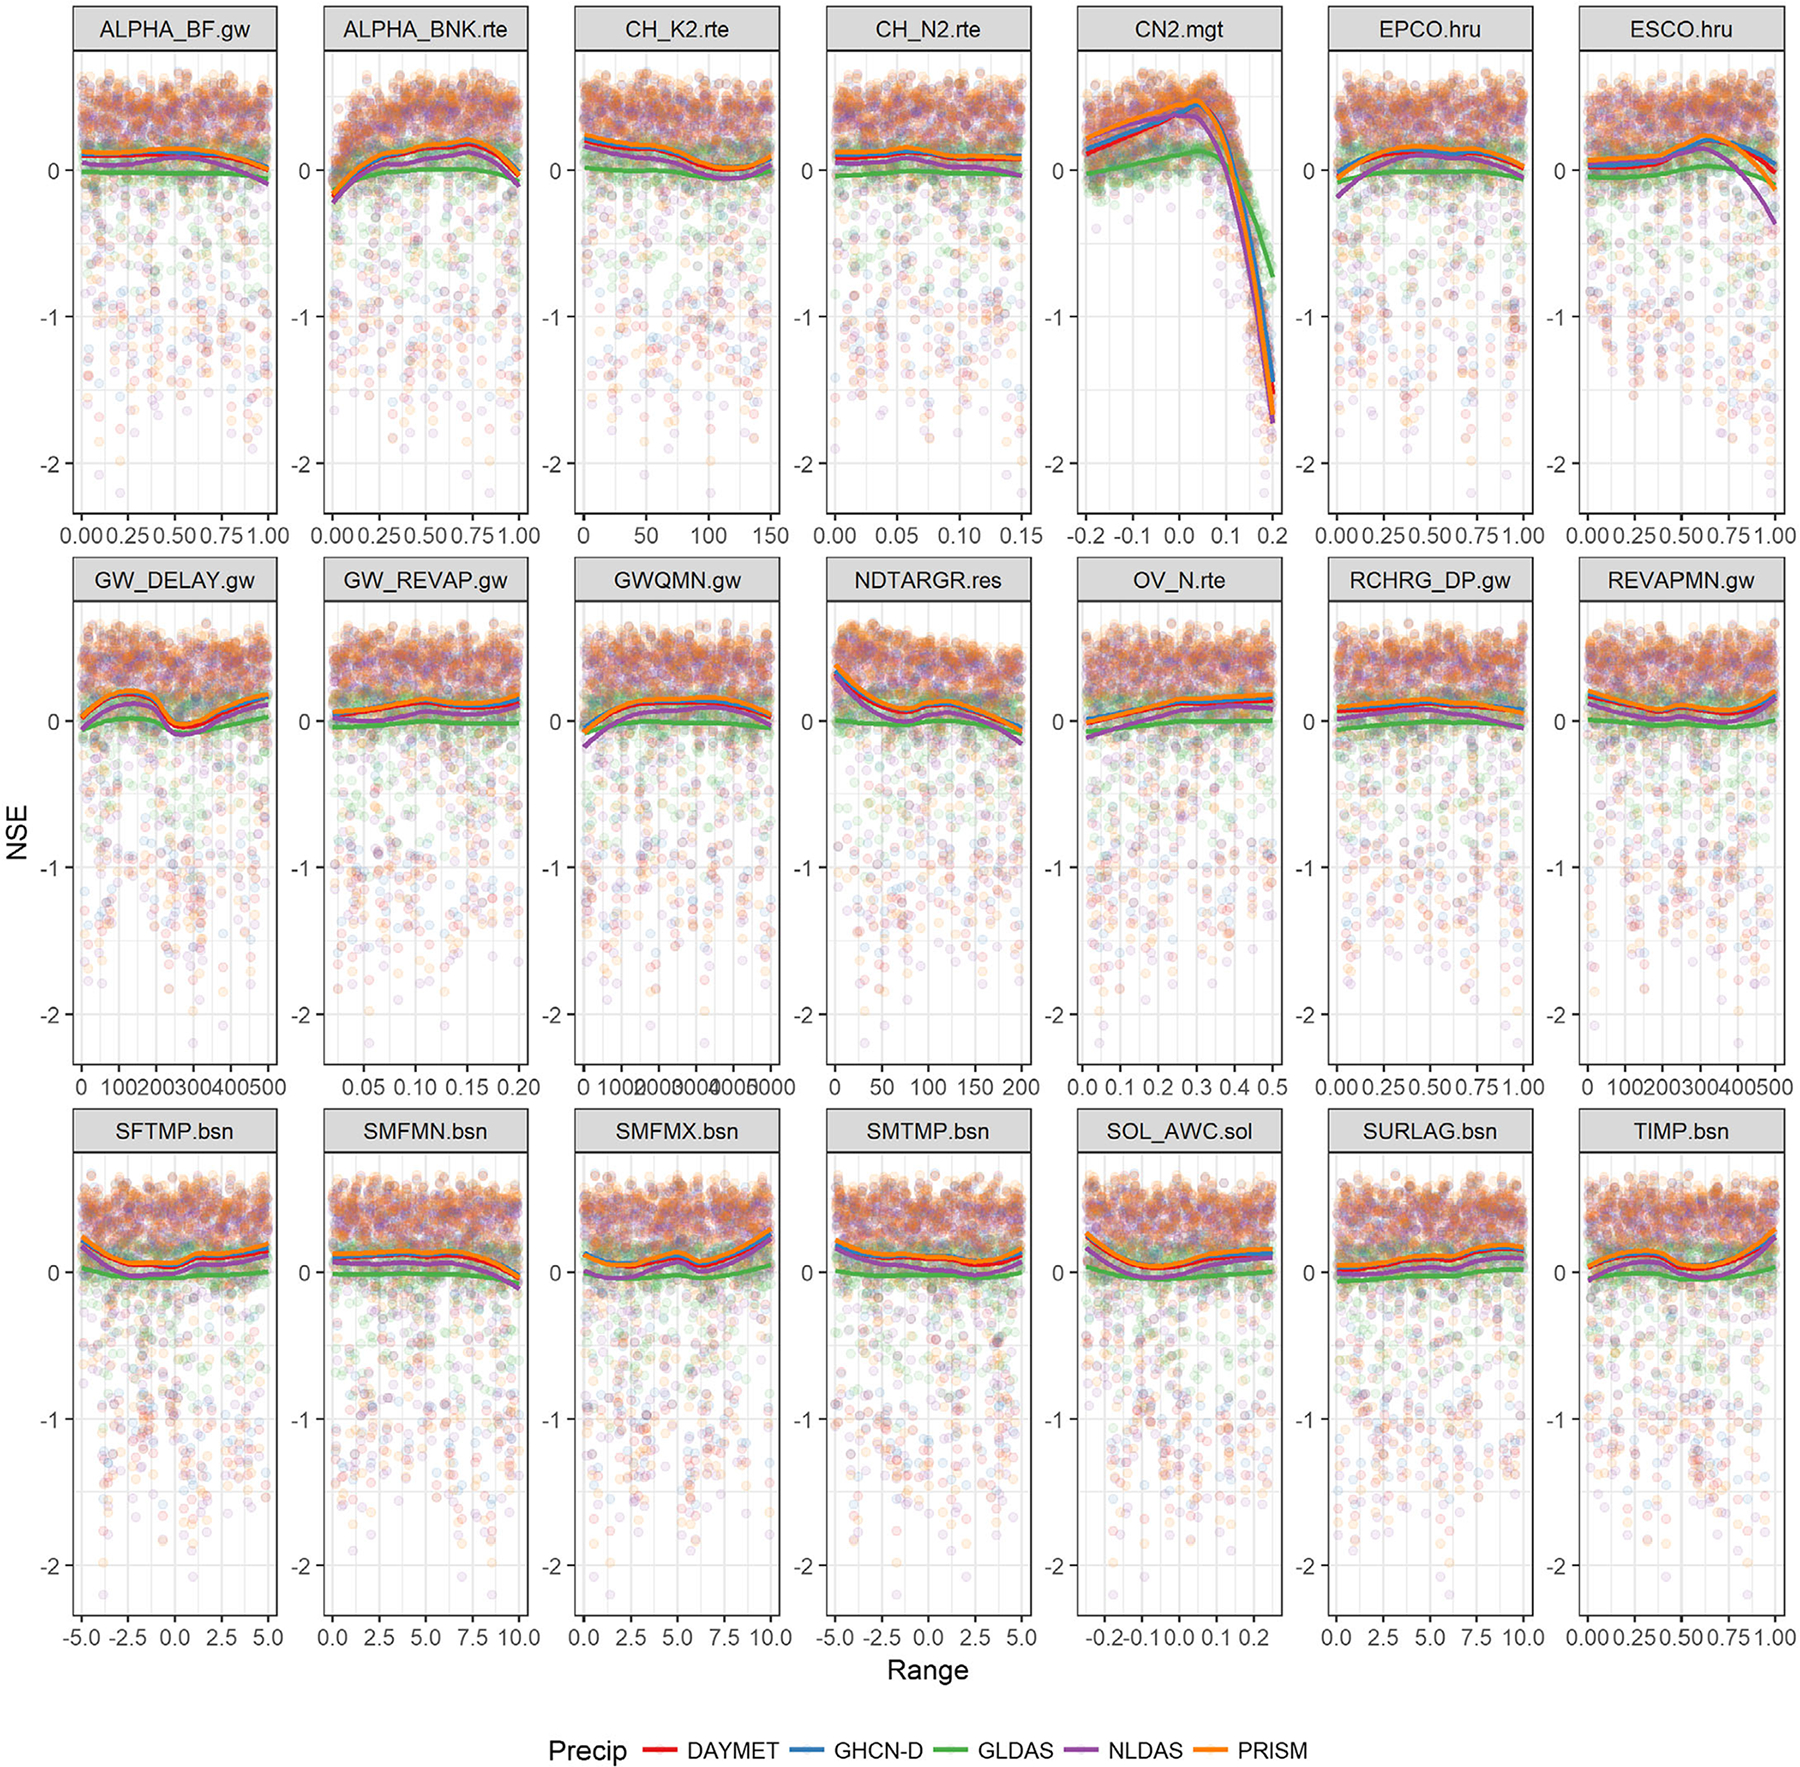
FIGURE 7.

Scatter plots of likelihood values of 500 simulations along with the variation in parameters and their distributions for all precipitation sources during calibration period. Parameter distributions were smoothed using default “loess” method. NSE, Nash–Sutcliffe efficiency.
