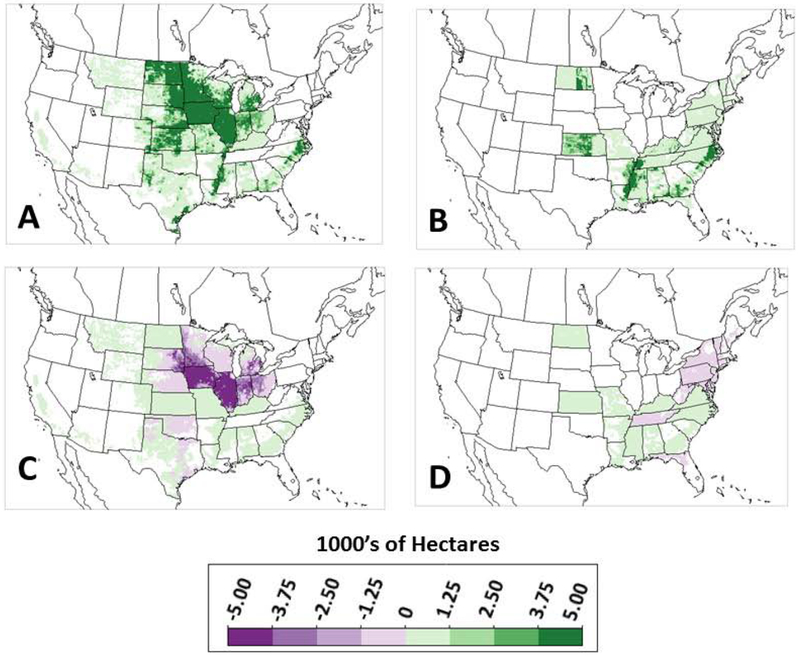
Figure 4:
A) Maize cropland reallocation, B) Soybean cropland reallocation, C) Soybean cropland reallocated to Maize, D) Maize cropland reallocated to soybean. All areas are reported as hectares per simulation grid cell. Grid cell area is 14400 ha. Note: The lightest green plotting bin includes zero values, i.e., no change.

