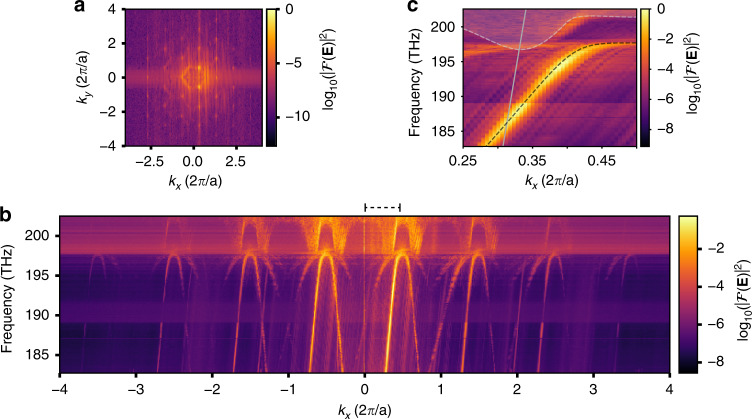
Fig. 2. Momentum space of the VPC edge state.
a Two-dimensional Fourier transform of the real-space amplitude distribution of the PhC mode. High-intensity points are periodically separated by the reciprocal lattice vector 2π/a in the direction of propagation kx along the edge and by 4π/√3a in the transverse direction ky, representing the bulk reciprocal symmetry. b Experimentally retrieved dispersion diagram. Bright lines of positive slope indicate positive group velocity (forward-propagating modes), while lines with negative slope indicate a negative group velocity (backward-propagating modes). Consecutive Bloch harmonics are separated by the size of a single Brillouin zone (2π/a). Frequencies above 197.5 THz correspond to bulk bands. The Fourier intensity for each excitation frequency is normalized to the overall maximum value. In addition to the dominant modes in the forward and backward directions, lines with half and a third of the dispersion slope appear. These are attributed to a nonlinear interaction with the scanning near-field probe (see Supplementary Sec. III). c A close-up of the experimentally retrieved dispersion diagram limited to the first Brillouin zone is denoted by black dashed brackets in b. The black dashed lines indicate the numerically simulated values for the edge state (see Methods for details). The solid gray line denotes the light line and the gray dashed lines with grayed-out regions indicate the onset of the bulk bands

