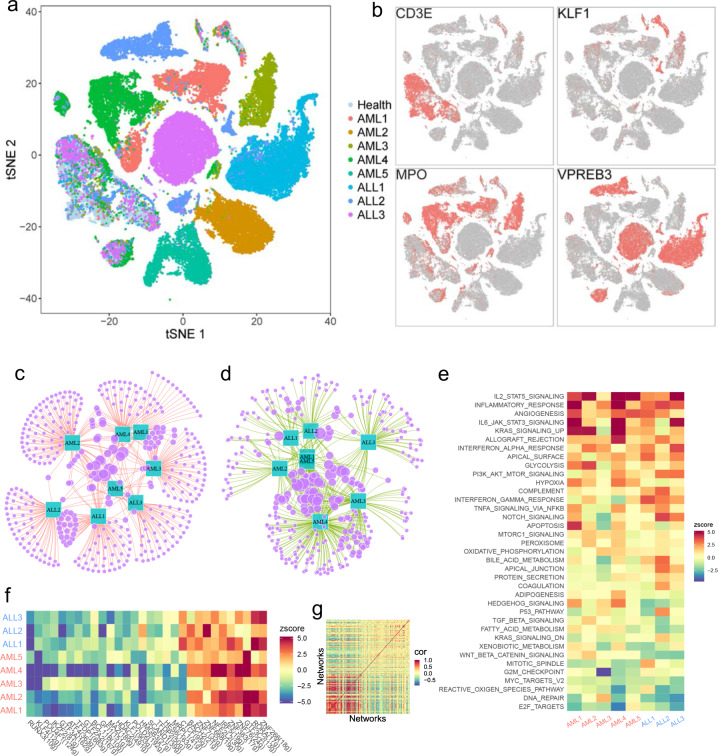
Fig. 3. Heterogeneity of leukemia cells and shared features among multiple patients.
a tSNE projection of BMMCs from 1 healthy individual and 8 leukemia patients, colored by different individuals. b tSNE projection of BMMCs from leukemia patients, with each cell colored based on its expression of CD3E, KLF1, MPO, VPREB3, respectively. c Majority of upregulated genes among leukemia patients are patient specific. d Majority of downregulated genes among leukemia patients are patient specific. e Pathway or gene sets commonly upregulated and downregulated among leukemia patients. Z-score > 0 means upregulation of pathways while Z-score < 0 means downregulation. f Shared upregulated and downregulated TF networks among leukemia patients. Z-score > 0 means upregulation of TF networks while Z-score < 0 means downregulation. g Correlation of TF networks in leukemia patients, in which TF networks were sorted based on their enrichment score decreasingly.

