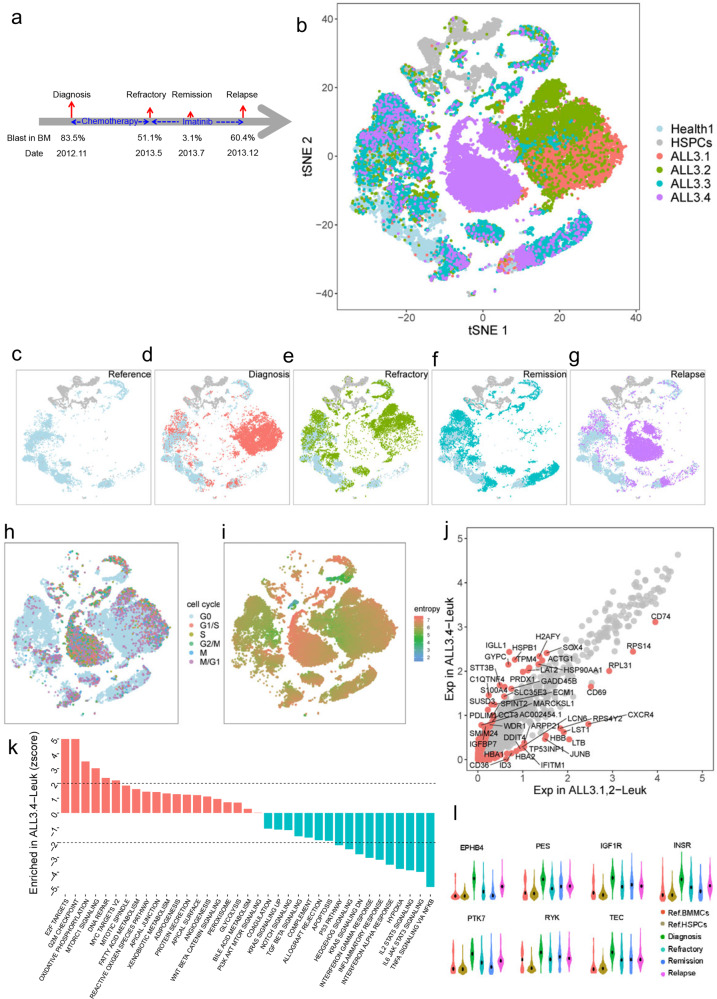
Fig. 5. Cell population dynamics of cell populations in patient ALL3 and the underlying genes.
a Sampling information the patient ALL3 at diagnosis, refractory, remission and relapse. b tSNE projection of all BMMCs from this patient and reference cells. c–g tSNE projection of reference cells and BMMCs at each phase. Reference cells only (c), diagnosis (d), refractory (e), remission (f) and relapse (g). h Cell cycle of patient BMMCs and reference cells. i Entropy of patient BMMCs and reference cells. j Significantly differential genes between pre-and post-relapse leukemia cells. k Significantly enriched pathway and gene sets between pre- and post-relapse leukemia cells. l The expression dynamics of some tyrosine kinase (TKs) based on scRNA-seq.

