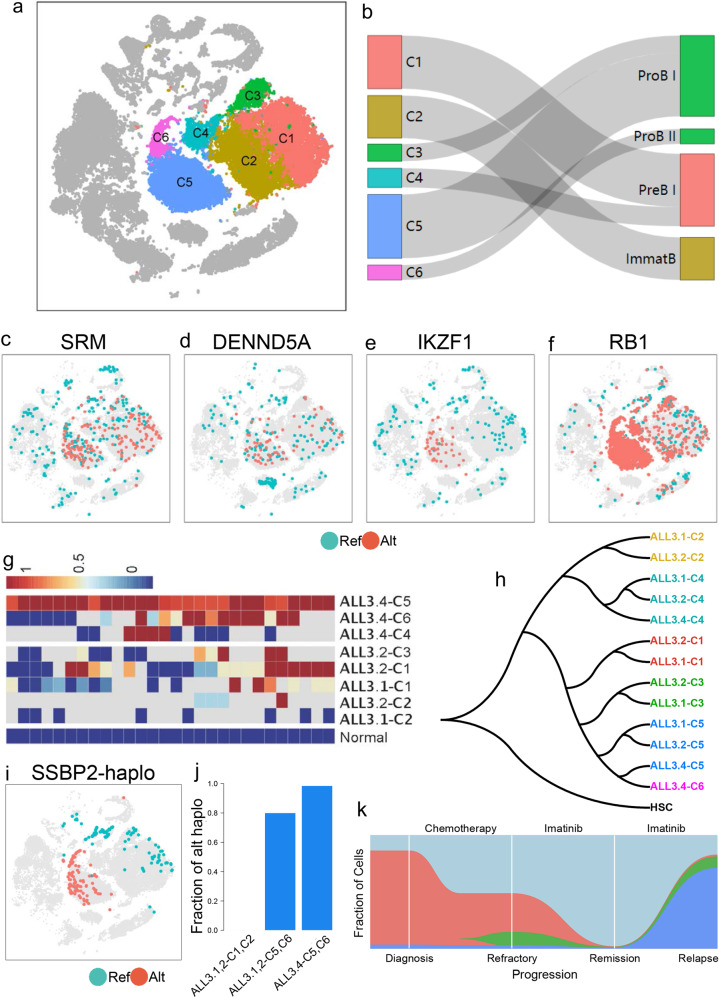
Fig. 6. Tracing relapsed leukemia cells and leukemia progression model.
a Clustering of leukemia cell subpopulations of ALL3. b Healthy counterparts of leukemia cell subpopulations, the healthy cell populations are listed by order of lymphoid lineage. c, d Distributions of leukemia cell-specific high variants on SRM (c) and DENND5A (d). e, f Distribution of relapsed leukemia cell-specific high variants on IKZF1 (e) and RB1 (f). g Distribution of genetic variants in different cell subpopulations. h Hierarchical tree of leukemia cell subpopulations, in which relapsed leukemia cells and earlier leukemia cells in C5 were clustering together. i Distribution of reference haplotype and alterative haplotype of SSBP2 in BMMCs. j Frequencies of relapsed-specific SSBP2 haplotype (alt haplo) in different leukemia cell subpopulations. k Progression model of patient ALL3. Ribbons with different colors present different leukemia subpopulations across the four stages, in which red ribbon stands for major leukemia cells (C1, C2) of diagnosis and refractory stages, blue and purple ribbons stand for relapsed leukemia cells (C5, C6), green is the minor population of leukemia cells from refractory to relapse stage, while light blue is normal cells.

