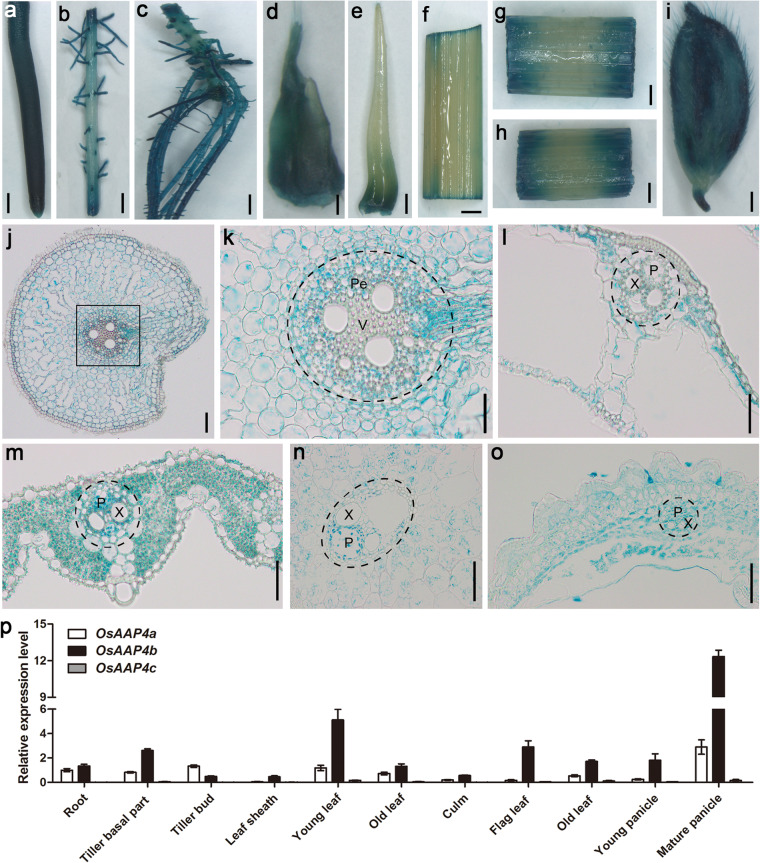
Fig. 2.
Promoter-GUS analysis and relative expression level of OsAAP4. OsAAP4 promoter-GUS staining in the root tip (a), lateral root (b), adventitious roots (c), short outgrowth bud (d), long outgrowth bud (e), leaf blade (f), leaf sheath (g), stem (h), and panicle (i) using the Hap2-Indica type of pOsAAP4-GUS-transgenic plants. Transverse section of a root (j) and its enlargement (k), leaf sheath (l), leaf blade (m), stem (n), and panicle (o) using the Hap2-Indica type of pOsAAP4-GUS transgenic plants. p The expression pattern of OsAAP4 in different tissues of Japonica ZH11. The primers used for quantifying OsAAP4a expression was F: TGGCACTCACCCTTGCACAC, and R: CCGTCCACACCGTCCCTTGT, for quantifying OsAAP4b expression was ACTTGAGCTCTCTGCATTGGGT, and R: AGCGGTAGCAATTGGCGAGGA, and for quantifying OsAAP4b + c expression was TTGCTGCAGGTGTTCGCGCA, ATCGTCCGCAGCACCAGCTTCAG which primers were designed for common sequences between two splice variants OsAAP4b and OsAAP4c. OsAAP4c of the two splice variants accounts for half of the expression level for both the splice variants. Pe indicates pericycle, V indicates vascular, X indicates xylem, and P indicates phloem in (k-o). Scale bars, 0.5 cm (a-c, f-h), 0.2 cm (d), 0.1 cm (e, i), 50.0 μm (j), 20.0 μm (k-o)

