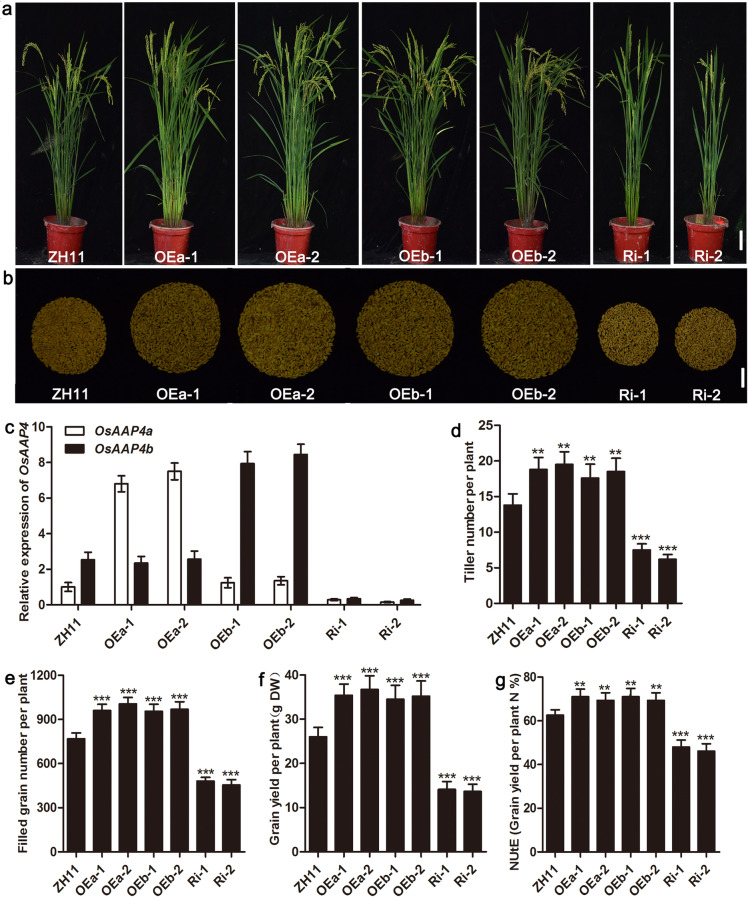
Fig. 3.
Phenotypic analysis of OsAAP4 transgenic plants in the Japonica ZH11 background grown in Wuhan paddy fields. Whole-plant phenotype (a), grain yield phenotype (b), relative expression of OsAAP4 in the leaf blade (c), tiller number per plant (d), filled grain number per plant (e), grain yield per plant (f) and nitrogen utilization efficiency (NUtE) of transgenic plants and ZH11 (g). OEa-1 and OEa-2 indicate long variants of OsAAP4a-overexpressing lines, OEb-1 and OEb-2 indicate short variants OsAAP4b-overexpressing lines, and Ri-1 and Ri-2 indicate OsAAP4-RNAi lines. The primers used for quantifying OsAAP4a expression was F: TGGCACTCACCCTTGCACAC, and R: CCGTCCACACCGTCCCTTGT, for quantifying OsAAP4b expression was ACTTGAGCTCTCTGCATTGGGT, and R: AGCGGTAGCAATTGGCGAGGA. The letters above the error bars are ranked by the T test, “**” indicates a significant difference at p < 0.01, and “***” indicates a significant difference at p < 0.001. Scale bar, 10.0 cm (a), 2.0 cm (b). Values are means ± s.d. (n > 20)

