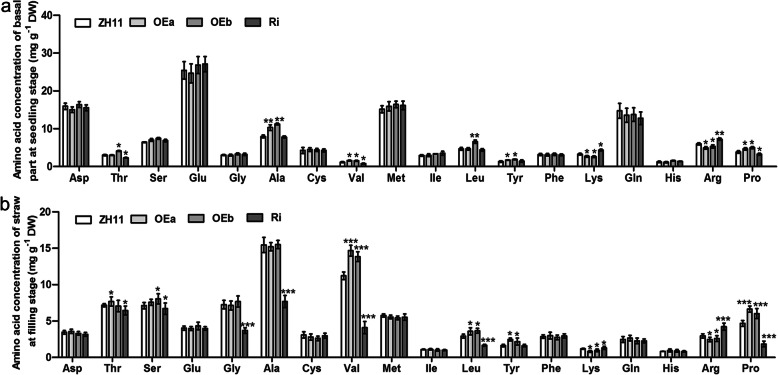
Fig. 4.
Effect of OsAAP4 on amino acid concentrations among ZH11, OEa, OEb, and Ri lines. Amino acid concentrations of basal parts at seedlings stage (a) and straw at filling stage (b). OEa, OEb, and Ri indicated that mixed equal-amount which extracted from each three OEa, OEb, and Ri lines, respectively. The letters above the error bars are ranked by the T test, “*” indicates a significant difference at p < 0.05, “**” indicates a significant difference at p < 0.01, and “***” indicates a significant difference at p < 0.001. Values are means ± s.d. (n = 3)

