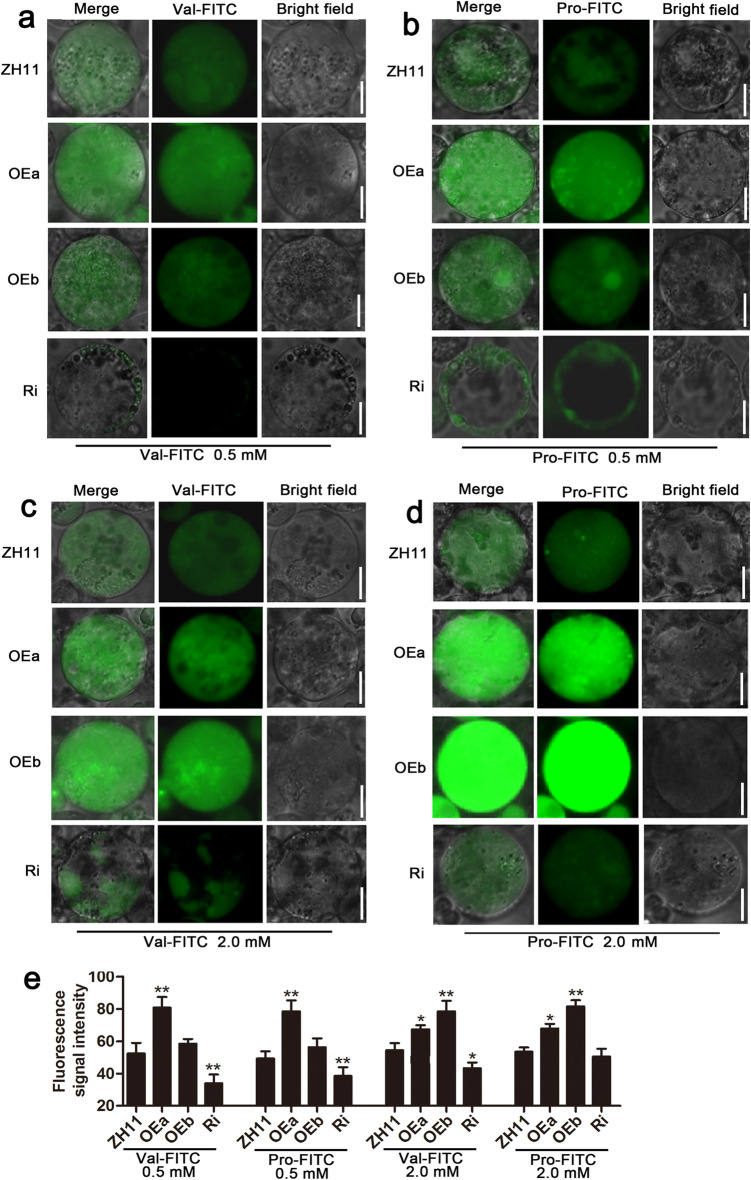
Fig. 6.
Protoplast amino acid-uptake assay among ZH11, OEa, OEb, and Ri lines. Fluorescence was detected after culturing protoplasts with FITC-labeled amino acids for 4 h. Green fluorescence images of ZH11 and OEa, OEb and Ri lines under treatment with 0.5 mM Val-FITC (a), 0.5 mM Pro-FITC (b), 2.0 mM Val-FITC (c), and 2.0 mM Pro-FITC (d). e Detection of cell fluorescence signal intensity in (a-d). Fluorescence intensities were normalized to the area of the respective cell by ImageJ software, and a total of 100 cells were statistically analyzed. Scale bars, 5.0 μm (a-d). The letters above the error bars are ranked by the T test, “*” indicates a significant difference at p < 0.05, and “**” indicates a significant difference at p < 0.01. Values are means ± s.d. (n = 3)

