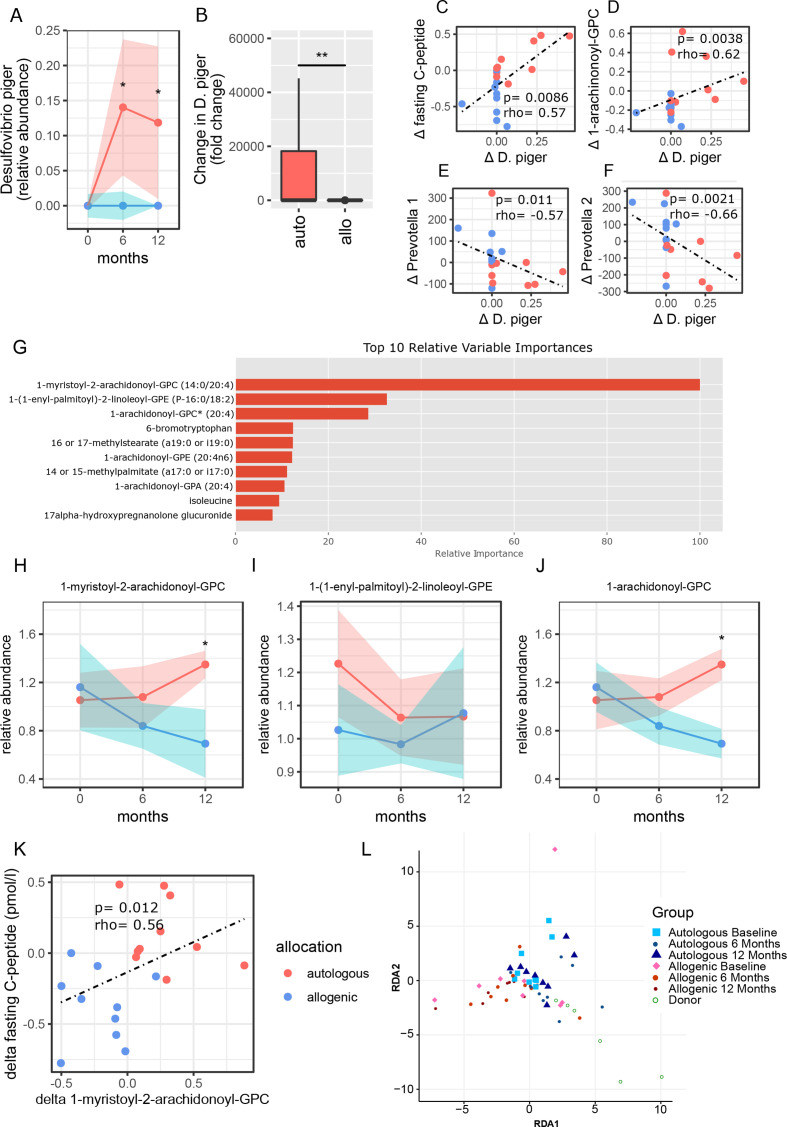
Figure 3.
Correlations of clinical outcomes with plasma metabolites and Desulfovibrio piger. (A) Abundance of faecal D. piger over time (allogenic: blue, and autologous: pink with width of colour band indicating SD). P values were calculated using Mann-Whitney U test. At 6 months p value=0.024, at 12 months p value=0.023. (B) Fold change in D. piger between the groups (allogenic: blue and autologous: pink). The delta p value was calculated by doing Mann-Whitney U test on the delta’s between 0 and 12 months of each group, p value=0.006. (C) Spearman correlation plot of delta (0–12 months) faecal D. piger and delta (0–12 months) of fasting C peptide. (D) Correlation plot of faecal D. piger and 1-arachidonoyl-GPC. (E) Correlation plot of faecal D. piger and small intestinal Prevotella 1. (F) Correlation plot of faecal D. piger and small intestinal Prevotella 2. (G) Top 10 metabolites that best predicted treatment group allocation allocation (XGBoost predictive modelling algorithm). Percentages are scaled towards the largest, which is set at 100%. Top three metabolites stand out with higher relative importance in the analysis. (H–J) Relative abundance of top three metabolites plotted against time (allogenic: blue and autologous: pink with width of colour band indicating SD). Medians±IQR (P25–P75) are reported. P values were calculated using Mann-Whitney U test between groups at 12 months. 1-myristoyl-2-arachidonoyl-GPC is different between groups at 12 months, p value=0.020. 1-arachidonoyl-GPC is different between groups at 12 months, p value=0.020. (K) Spearman correlation between change in fasting C peptide and change in 1-myristoyl-2-arachidonoyl-GPC. (G) RDA of fasting plasma metabolites over time in T1D compared with healthy donors. T1D, type 1 diabetes.

