Figure 4.
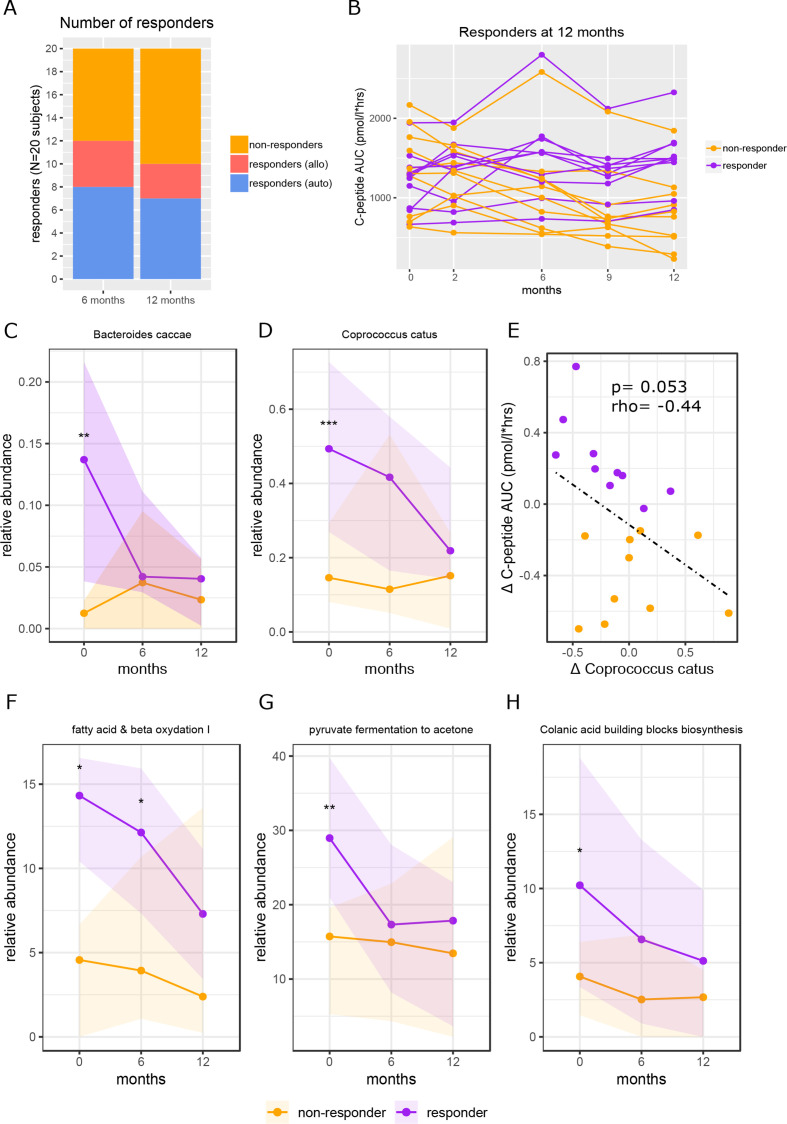
Baseline faecal microbiota and functional pathways in FMT clinical responders versus non-responders. Figure part A shows the number of responders at 6 months and at 12 months and how many subjects were in each treatment group. Response was defined as <10% decline in C peptide AUC compared with baseline. The 12 months responders were used for all analyses. Figure part B shows individual subject lines of C peptide AUC over time. Responders in purple and non-responders in yellow. Figure parts C and D show the abundance of Bacteroides caccae and Coprococcus catus over time, respectively. P values were calculated using Mann-Whitney U test between groups at each time point. For B. caccae at baseline the p value=0.0099, for C. catus at baseline the p value=0.00049. Figure part E shows the correlation between delta C. catus (0–12 months) and delta C peptide AUC (0–12 months). Spearman’s rho (r) is shown, and the p value was calculated using Spearman’s rank. Figure part F shows the relative abundance over time of fatty acid and beta oxidation, p value at baseline=0.014, p value at 6 months=0.011; figure part G shows the relative abundance over time of pyruvate fermentation to acetone, p value at baseline=0.0015; figure part H shows the relative abundance of time of the colonic acid building blocks biosynthesis pathways, p value at baseline=0.015. All p values were calculated using Mann-Whitney U test. AUC, area under the curve; FMT, faecal microbiota transplantation.

