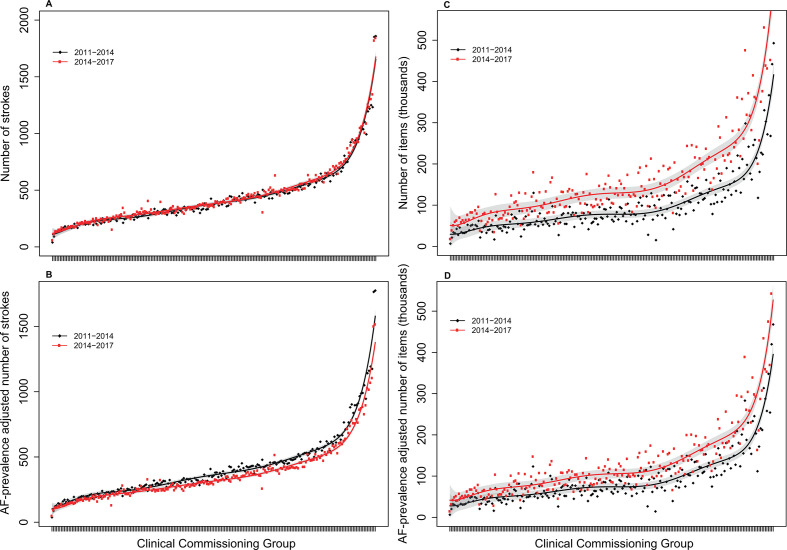
Figure 1.
Incidence of hospitalised AF-related stroke and number of oral anticoagulant items prescribed in 2011–2014 vs 2014–2017, ranked by size of clinical commissioning group. (A) Unadjusted numbers of AF-related strokes. (B) Numbers of AF-related strokes adjusted for annual AF prevalence. (C) Unadjusted numbers of oral anticoagulant items prescribed for patients with AF. (D) Numbers of oral anticoagulant items prescribed for patients with AF adjusted for annual AF prevalence. Hospitalised patients with AF-related stroke had stroke as a primary diagnosis and AF as a secondary diagnosis recorded in the Hospital Episode Statistics database. Stroke incidence was adjusted for the AF prevalence reported per year in the Quality and Outcomes Framework, compared with the level at 2011. The red and black curves represent the fitted incidence or number of items for the two study periods, and the grey areas represent the 95% confidence bands. AF, atrial fibrillation.

