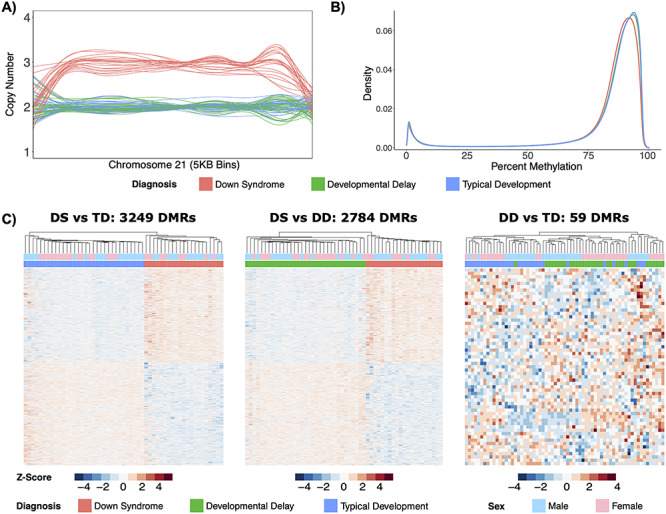
Figure 1.

Distinct DS methylome profiles. (A) Line plot of normalized copy number based on read depth over 5 kb bins for chromosome 21 in all 86 samples. (B) Density plot of average percent smoothed methylation for CpGs covered in the 3 diagnostic groups. (C) Heatmaps of significant (q < 0.05) DMRs from the DS versus TD comparison, significant (q < 0.05) DMRs from the DS versus DD comparison, and significant (p < 0.05) DMRs from the DD versus TD comparison. All heatmaps display hierarchal clustering of Z-scores, which are the number of standard deviations from the mean of non-adjusted percent smoothed individual methylation values for each DMR.
