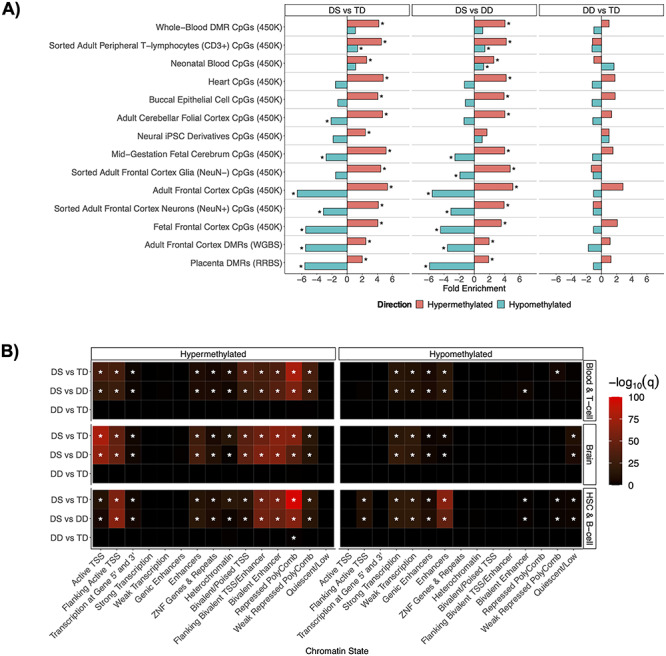
Figure 4.

Divergent DNA hyper- and hypo-methylation profiles. (A) DS cross-tissue enrichments for differential sites from existing DS studies. (B) Summary heatmap of top q-values for Roadmap epigenomics 127 reference epigenomes chromHMM chromatin state enrichments for all comparisons within the blood and brain tissue reference datasets. *q < 0.05.
