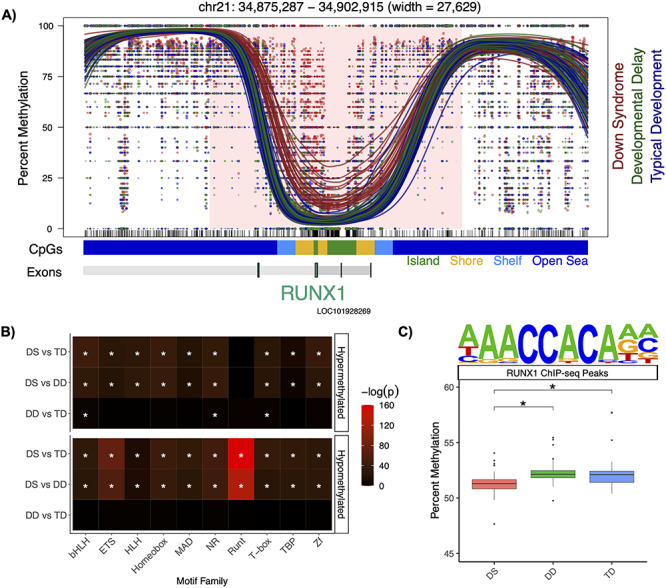
Figure 5.

RUNX1 profile. (A) Significant (q < 0.05) hypermethylation within the RUNX1 block. The lines represent individual smoothed methylation level estimates for DS (red), DD (green) or TD (blue). The dots represent the methylation level estimates of an individual CpG, and the size of each dot is representative of coverage. CpG and genic annotation tracks are shown below each plot, and the RUNX1 gene is encoded on the negative strand. (B) Summary heatmap of top P-values for top 10 transcription factor motif family enrichments for all comparison groups (*q < 0.05). (C) Mean percent smoothed DNA methylation levels in RUNX1 binding sites alongside the motif (*Padjusted < 0.05).
