
Figure 3.
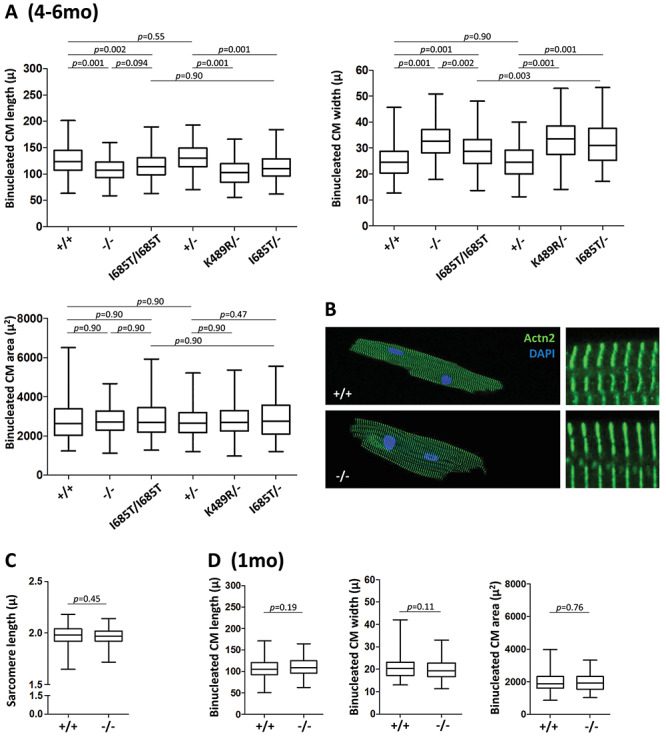
Cardiomyocyte cellular remodeling. (A) Length, width and area measurements of individual binucleated cardiomyocytes from 4 to 6 month old mice of the indicated genotypes, shown as a bars and whiskers plot (mean, middle quartiles and full range of data). Numbers of cells measured are listed in Table 2. Measurements were aggregated from roughly equal numbers of cells from 4 to 6 mice of the indicated genotypes. The (minimal) variance between cell preparations from individual mice is shown in Supplementary Material, Figure S2A. (B) Visualization of sarcomere structure and organization in cardiomyocytes from 6 month old mice by alpha-actinin2 (Actn2) staining and confocal microscopy. The cells shown correspond to the average dimensions measured in panel A. (C) Measurement of sarcomere length, obtained from the same evaluation used to measure sarcomere shortening during contraction that is shown in Figure 4A. (D) Length, width and area measurements of individual binucleated cardiomyocytes from 1 month old mice of the indicated genotypes; see also Table 2. The same analysis expressed on a per mouse basis is shown in Supplementary Material, Figure S2B.