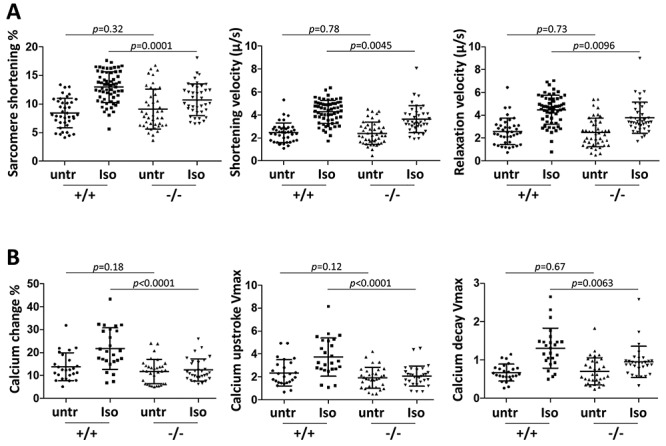
Figure 4.

Cardiomyocyte contractility and calcium dynamics without and with isoproterenol treatment. (A) Cardiomyocyte contractility in paced cells. Sarcomere shortening percent at peak contraction, shortening velocity and relaxation velocity were measured for individual cardiomyocytes during the contraction cycle, in untreated (untr) and isoproterenol (Iso) treated cells. Cells were either untreated or treated, but not both. Single cell preparations from 11 +/+ mice and 9 −/− mice were used in this analysis. (B) Calcium dynamics in paced cells measured by Fura-2 signal. Percent change in cytoplasmic calcium fluorescence at peak amplitude, and maximum fluorescence upstroke and fluorescence decay velocities (units of fluorescence/sec) were measured for individual cardiomyocytes during the contraction cycle. Each dot indicates measurement for an individual cell from 8 +/+ mice and 8 −/− mice. See also Supplementary Material, Table S1 for statistical comparison of untreated versus treated cells by genotype.
