Figure 1.

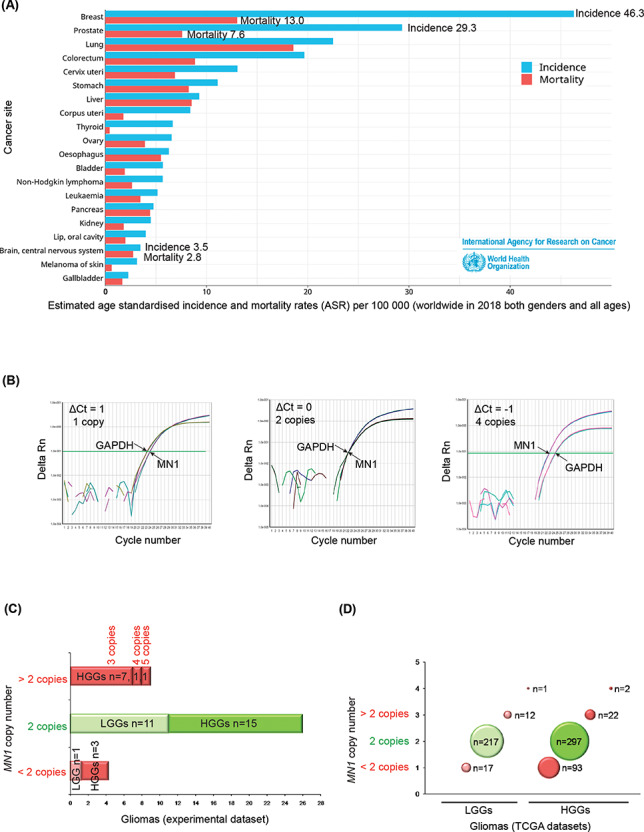
Epidemiological data and copy number analysis of MN1 gene in gliomas. (A) Bar graph showing global estimates of age standardized incidence and mortality rates (ASR) per 100 000 people, in both genders and all ages in the year 2018, and is arranged according to top 20 cancer sites (3). (B) qPCR amplification plots with MN1 as the gene of interest and RNaseP as the reference gene where ΔCt = 1 (left panel), ΔCt = 0 (middle panel) and ΔCt = −1 (right panel) correspond to one, two and four copies of MN1 gene, respectively. (C) Bar graph summarizing MN1 copy number details of gliomas examined in the present study. Red and green bars indicate cases that have altered and normal copy numbers, respectively. ‘n’ denotes the number of cases (LGGs or HGGs as indicated). (D) Bubble plot showing copy number status of MN1 gene in LGGs and HGGs from the TCGA datasets. Red and green bubbles represent cases with CNAs and normal (2) copy number, respectively. Number of cases (n) in each category is indicated along the bubble.
