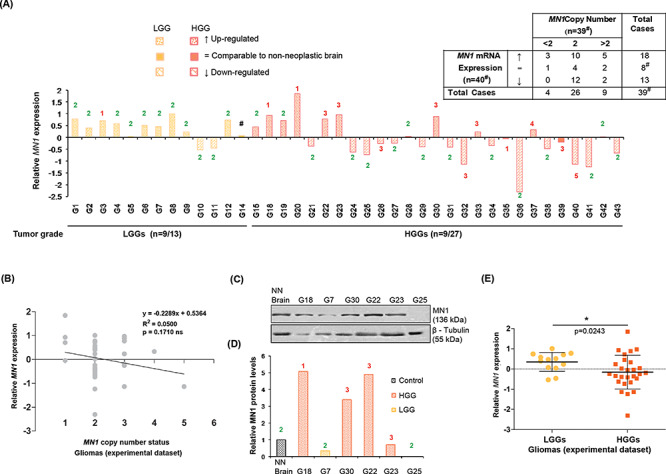
Figure 2.

MN1 expression and its relation with the gene’s copy number alterations in gliomas. (A) Bar graph depicting relative MN1 mRNA expression (normalized to non-neoplastic brain tissues) in the experimental dataset. Numerals indicated above/below each of the bars denote copy number of MN1 gene in the corresponding glioma cases. #Case G14 showed upregulated MN1 transcripts but was not evaluable for the gene’s copy number. No. of cases showing overexpression versus total no. of cases analyzed for the two categories are mentioned below the x-axis. Inset tabulated summary of MN1 mRNA expression and copy number data in gliomas. ↑, = and ↓ signify upregulated expression, comparable and downregulated transcript levels relative to the non-neoplastic brain, respectively. (B) Scattergram shows ability of MN1 copy number to predict MN1 expression in gliomas (n = 39). Linear regression line fitted to the data is shown and ‘R2’ represents coefficient of determination. (C) Immunoblots and (D) graphical representation of densitometric evaluation of immunoblots, showing MN1 protein expression in representative glioma cases. β–tubulin was used as an experimental control. NN Brain indicates non-neoplastic sample used as control. (E) Graph summarizing relative MN1 mRNA expression in LGGs (n = 13) and HGGs (n = 27), where the central bar and whiskers indicate mean (±SD) values.
