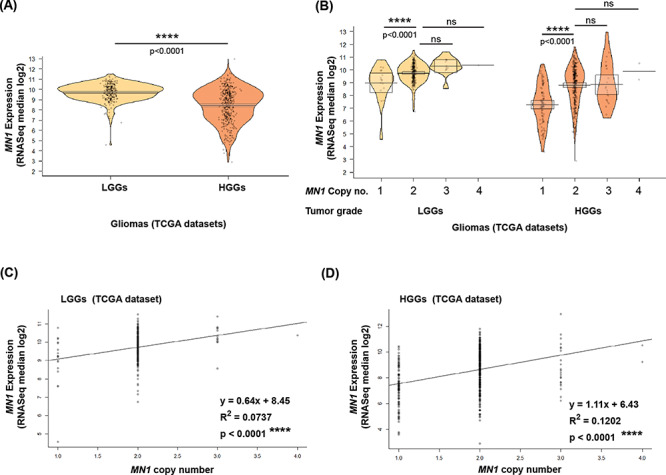
Figure 3.

MN1 expression (RSEM) is not related to CNA in TCGA glioma datasets. Pirate plots showing MN1 expression observed in (A) LGGs (n = 249) and HGGs (n = 417), and (B) classified according to MN1 CNA in a grade wise manner (x-axis). P-values for statistical comparison of gene expression between glioma grades and cases with different copy number status are indicated above the plots. Regression analysis depicting MN1 expression (log transformed RNAseq median or RSEM values) as a function of CNA of the gene in (C) LGGs (n = 246) and (D) HGGs (n = 412). Linear regression line fitting the data is shown in black, and ‘R2’ represents the coefficient of determination.
