
Figure 4.
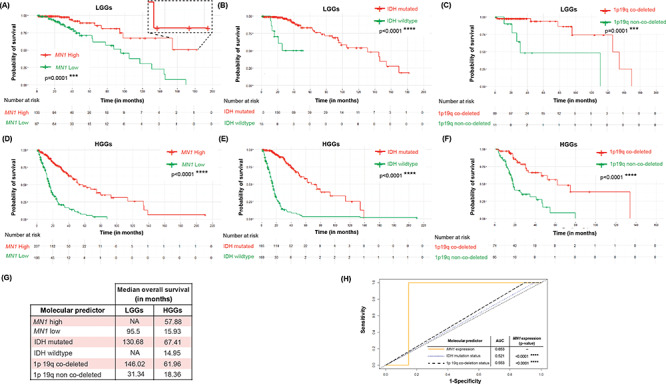
MN1 overexpression predicts better OS in gliomas. Kaplan–Meier survival curves stratify LGGs by (A) MN1 expression (n = 247), (B) IDH mutation status (n = 226) and (C) 1p19q deletion status (n = 100). HGGs are classified into sub-groups based on the association of probability of survival with (D) MN1 expression (n = 393), (E) IDH mutation status (n = 354) and (F) 1p19q deletion status (n = 139). P-values are computed using log-rank test that is used to evaluate significance. (G) Tabulated summary shows median OS for the different survival curves. ‘NA’ denotes values not available. (H) ROCs combined curve of MN1 expression, IDH mutation status and 1p19q deletion status in LGGs (n = 100). Values of AUC are indicated along with P-value for group-wise comparison with MN1 expression.