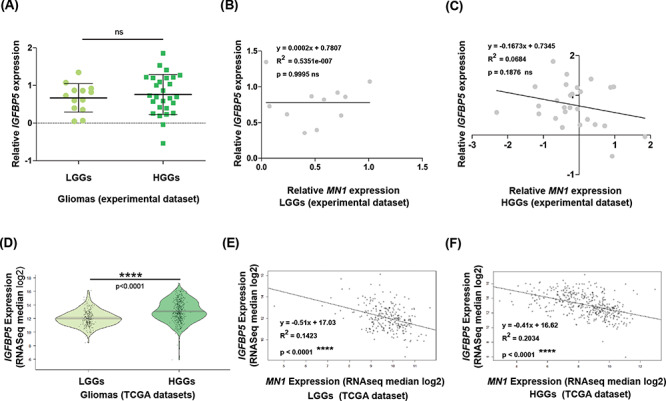
Figure 6.

IGFBP5 expression, determining its association with MN1 levels in gliomas. (A) Graphical summary of relative IGFBP5 expression in LGGs (n = 13) and HGGs (n = 27) of the experimental dataset. The central bar and whiskers denote mean (±SD). Linear regression plots to test the association of IGFBP5 expression with MN1 expression levels in (B) LGGs (n = 11), and (C) HGGs (n = 27). (D) Pirate plots showing IGFBP5 expression (log transformed RNAseq median values) in LGGs (n = 249) and HGGs (n = 417) from the TCGA datasets. Scatter plots show the relatedness of IGFBP5 expression with MN1 expression levels in (E) LGGs (n = 249) and (F) HGGs (n = 417). The black regression line represents the regression model fitted to the data, and ‘R2’ refers to the coefficient of determination. Statistical test values comparing gene expression between the glioma grades are indicated above the respective plots.
