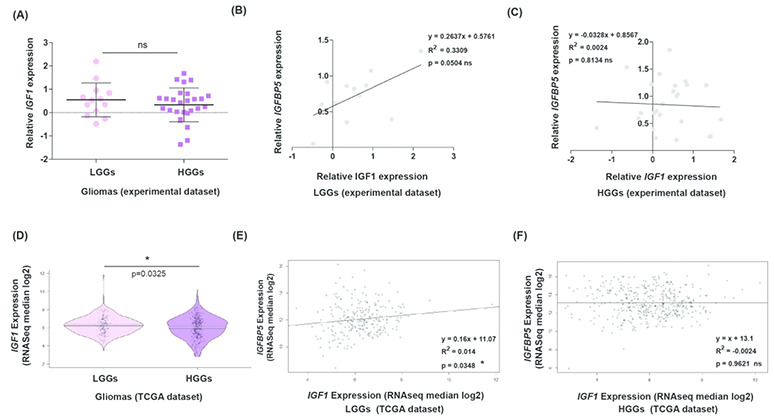
Figure 7.

IGF1 and IGFBP5 expression does not correlate in high-grade gliomas. (A) Dot-plots representing relative IGF1 expression between LGGs (n = 13) and HGGs (n = 27). Scatter plots show linear regression model assessing relations between expression levels of IGFBP5 and IGF1 in (B) LGGs (n = 12) and (C) HGGs (n = 25). (D) In the TCGA datasets, IGF1 expression is noticeably lower in HGGs (n = 417) compared with LGGs (n = 249). Regression analysis plots assessing correlation between expression levels of IGFBP5 and IGF1 in (E) LGGs (n = 249) and (F) HGGs (n = 417). In all regression analysis plots, line fitting the data scatter is represented in black and ‘R2’ represents the coefficient of determination.
