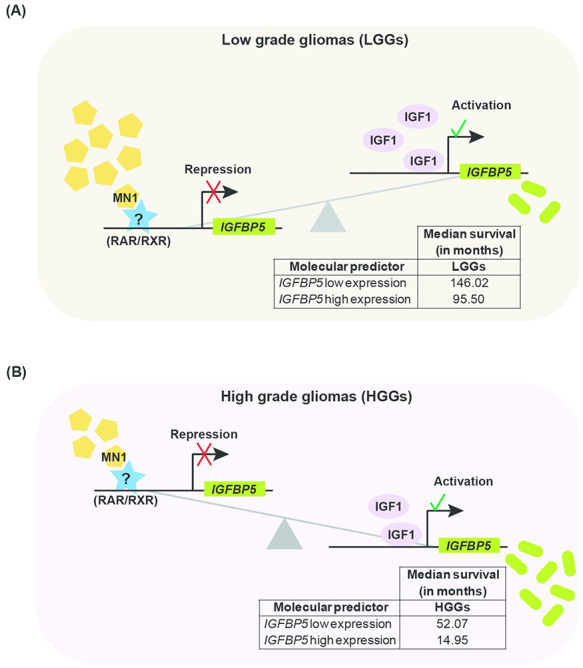
Figure 8.

Model summarizing the association between MN1, IGFBP5 and IGF1 expression in gliomas and their possible molecular interplay. MN1, IGF1 and IGFBP5 are represented by specific symbols. In (A) LGGs and (B) HGGs, the numbers of a particular symbol denote relative abundance of the specific molecule, based on the findings of the present study. MN1 possibly synergizes with an unknown or known (RAR/RXR) repressor at regulatory elements in the IGFBP5 promoter to repress its expression in gliomas. Schematic suggests that (A) in LGGs, high MN1 levels transcriptionally repress IGFBP5, which offsets IGF1-mediated induction of IGFBP5 expression such that it is predictive of better median survival (table within the schematic), (B) whereas in HGGs, low levels of MN1 likely relieve transcriptional repression of IGFBP5, tilting the balance in favor of IGF1 mediated increase in IGFBP5 expression. This in turn estimates poor prognosis and lower median survival in HGGs than LGGs (table embedded in the schematic).
