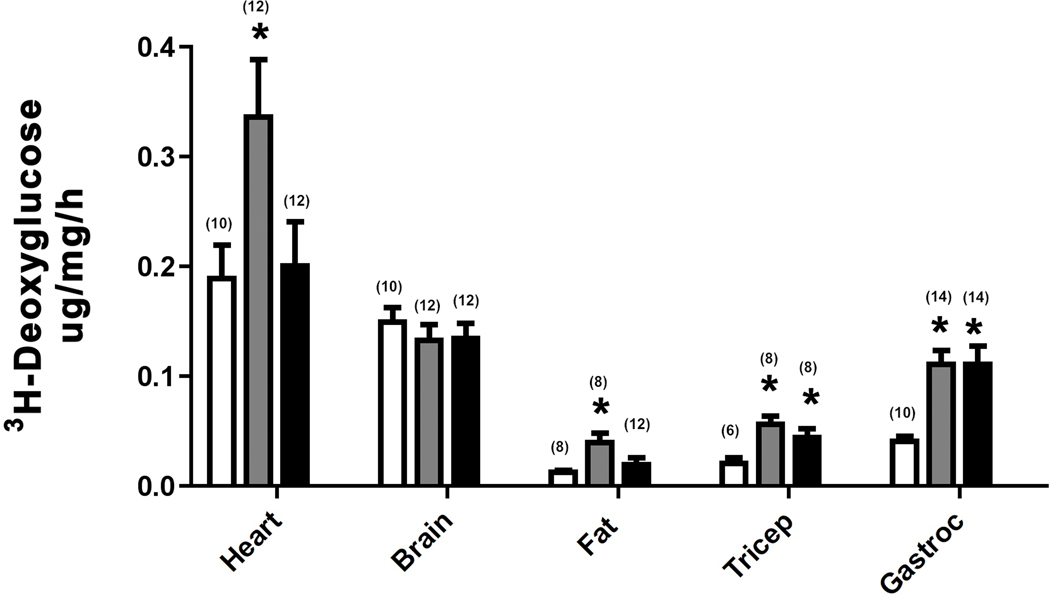
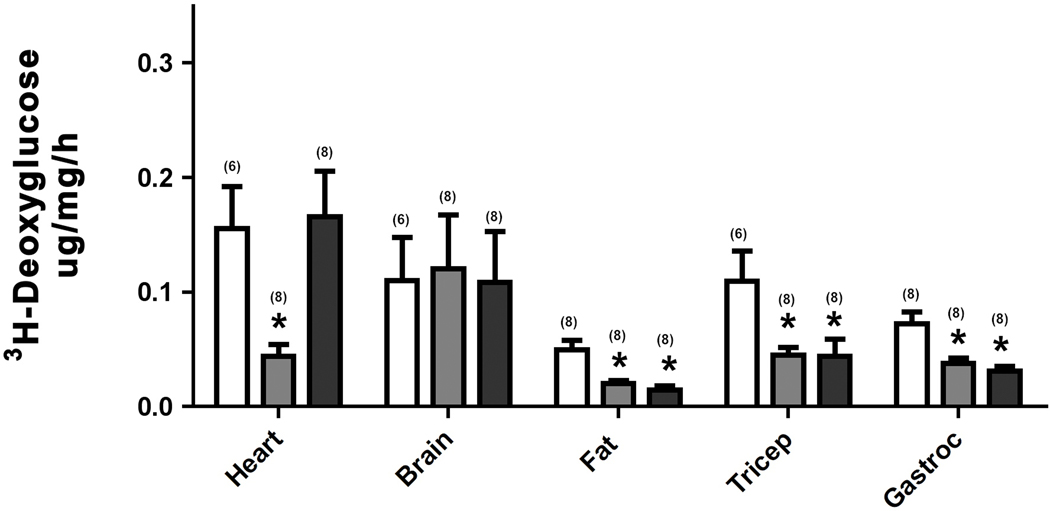
Figure 2. α1-AR regulation of 3H-deoxyglucose uptake.
Mice were fasted for 6 hours then injected with [3H]-2DG (20uCi/mouse; ip). Blood samples were taken from the tail vein at 30, 60, 90 mins post-injection using a Nova Max Plus glucometer. After the final collection of blood, mice were euthanized and tissues removed and frozen in dry ice. Tissues were processed and the glucose uptake rate was calculated according to the method of Ferre’, et al (1985). A. 3H-deoxyglucose uptake in tissues isolated from CAM α1A-AR (grey bars), CAM α1B-AR (black bars) mice and WT control (white bars). B. 3H-deoxyglucose uptake in tissues isolated from α1A-AR KO (grey bars), α1B-AR KO (black bars), and WT controls (white bars). * p≤ 0.05, statistically significant from WT control. N=6–14 mice (in parentheses). Gastroc (gastrocnemius muscle).


