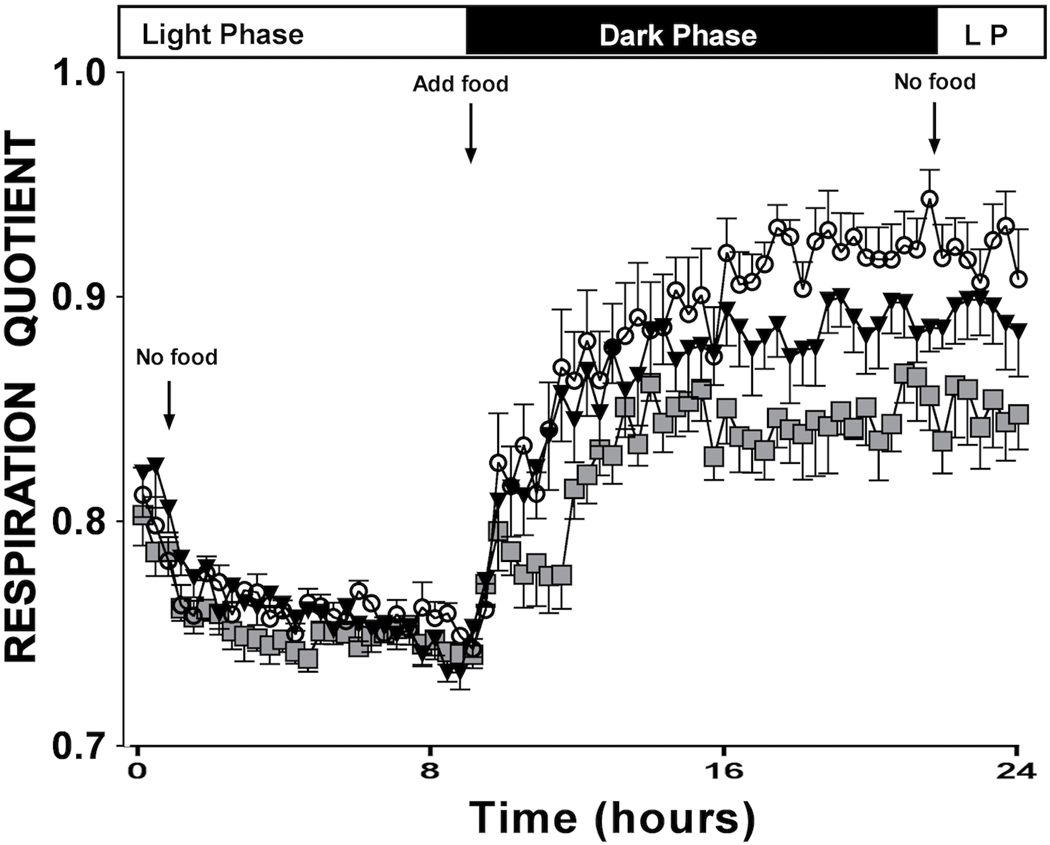
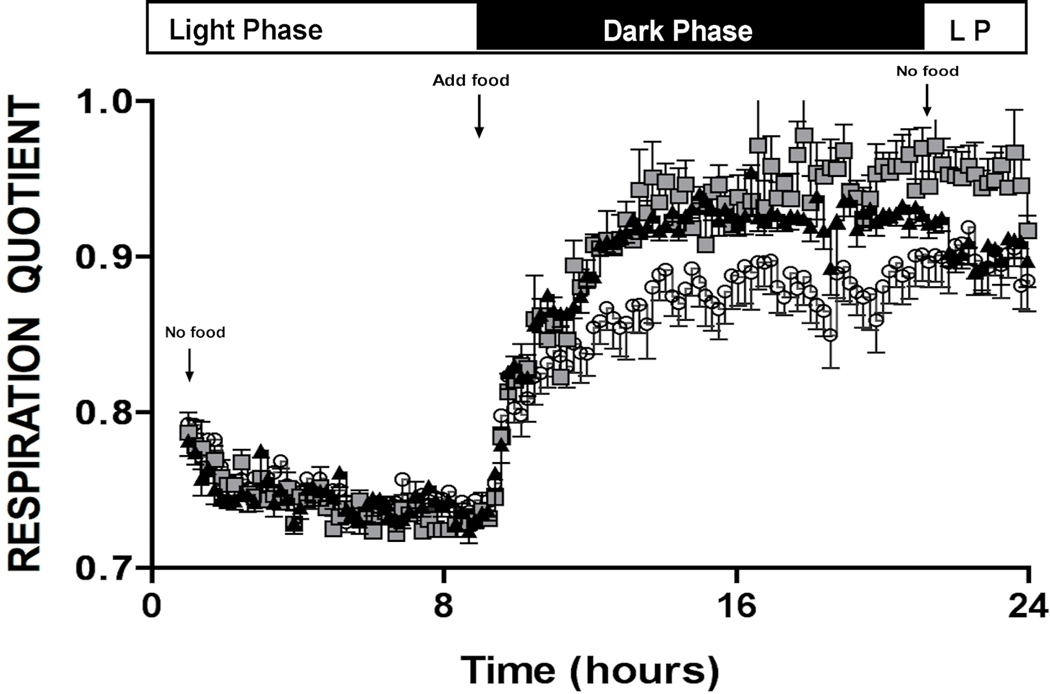
Figure 3. α1-AR regulation of whole body metabolism.
Metabolic rates are measured by indirect calorimetry in mice using an 8-chamber open-circuit Oxymax system. Briefly, mice are acclimated to the experimental room for 1 week prior and individually housed in acrylic calorimeter chambers through which air with a known O2 concentration is passed at a constant flow rate. The system automatically withdraws gas samples from each chamber hourly for 24 h and calculates the volumes of O2 consumed (VO2) and CO2 generated (VCO2). The respiratory quotient (RQ), which is the ratio of VCO2 to VO2, is calculated. A. RQ profile for CAM α1A-AR (squares), CAM α1B-AR (triangles) mice and WT control (circles). F(2,75)=36.76, p≤ 0.001. Both CAM statistically significant (P<0.001) from WT control using Repeated Measures ANOVA. B. RQ profile for α1A-AR KO (squares), α1B-AR KO (triangles), and WT controls (circles). N=6 or 8 mice. (F(2,130)=48.65, p<.001), Both KO statistically significant (p<0.001) from WT control using Repeated measures ANOVA.


