
Fig. 4.
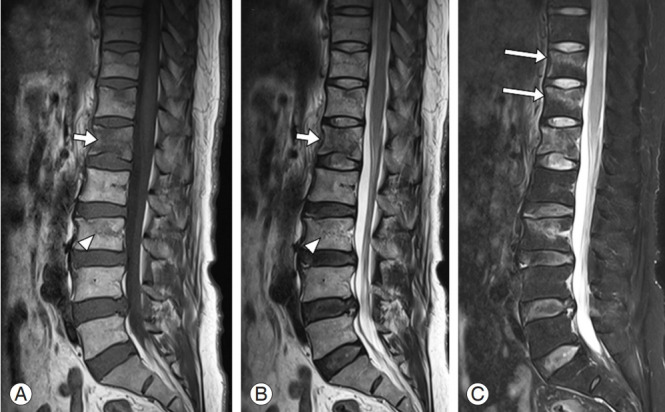
Sagittal T1- (A) and T2- (B) weighted magnetic resonance imaging of the lumbar spine showing definite signal change in L1 vertebral body (short arrows) and subtle marrow edema at the L3 vertebra (arrowheads). Additional T2 sagittal image with fat suppression technique showing the previously identified signal changes of L1 and L3 clearer, (C) while the occult fractures of the T11 and T12 vertebrae are clearly revealed due to the definite contrast of marrow edema (long arrows).