Fig. 4.

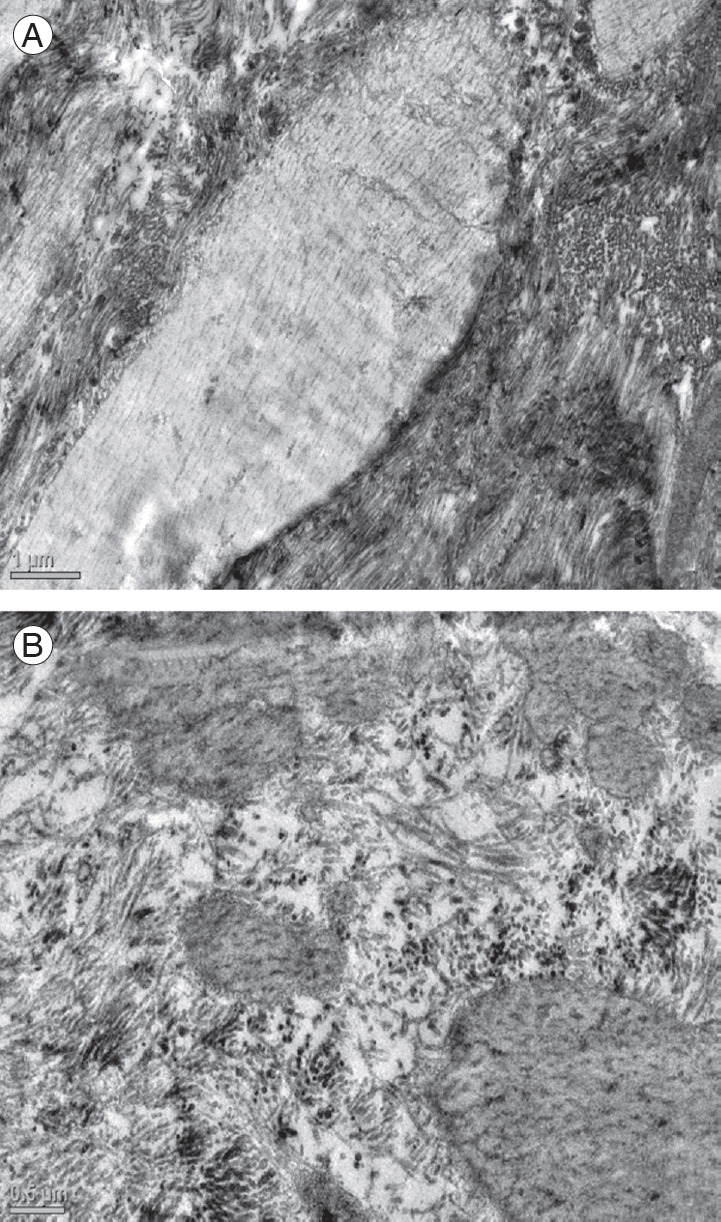
(A) Electron micrograph of the ligamentum flavum in a patient of the control group showing normal elastic fibers (×2,550) and (B) in a patient with degenerative lumbar canal stenosis showing marked thinning of elastic fibers (×4,000).

(A) Electron micrograph of the ligamentum flavum in a patient of the control group showing normal elastic fibers (×2,550) and (B) in a patient with degenerative lumbar canal stenosis showing marked thinning of elastic fibers (×4,000).