Figure 2:
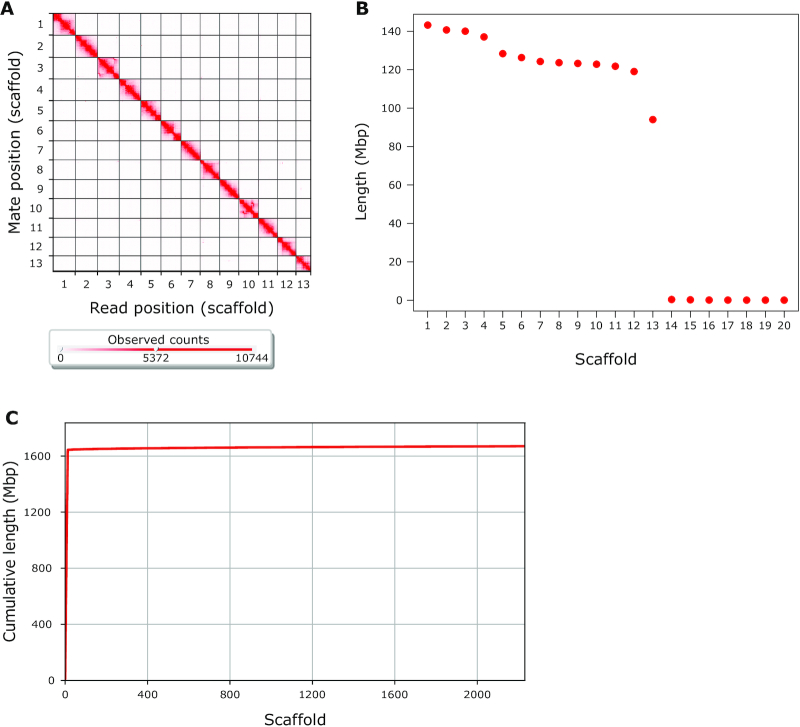
Argiope bruennichi genome assembly completeness. (A) Contact heat map of Hi-C scaffolding shows long-range contacts of paired-end Hi-C reads. Gray gridlines denote scaffold (chromosome) boundaries. Visualized with Juicebox (v. 1.11.08) [64]. (B) The length of the 20 longest scaffolds in the assembly shows that the 13 putative chromosome scaffolds are much larger than the next largest. Red points represent individual scaffolds, ordered from largest to smallest. (C) Cumulative length of assembly contained within scaffolds. Note that almost all (98.4%) of the genome is contained within very few scaffolds. Visualized with QUAST v. 5.0.2 [60] using default parameters, except –min-contig 0.

