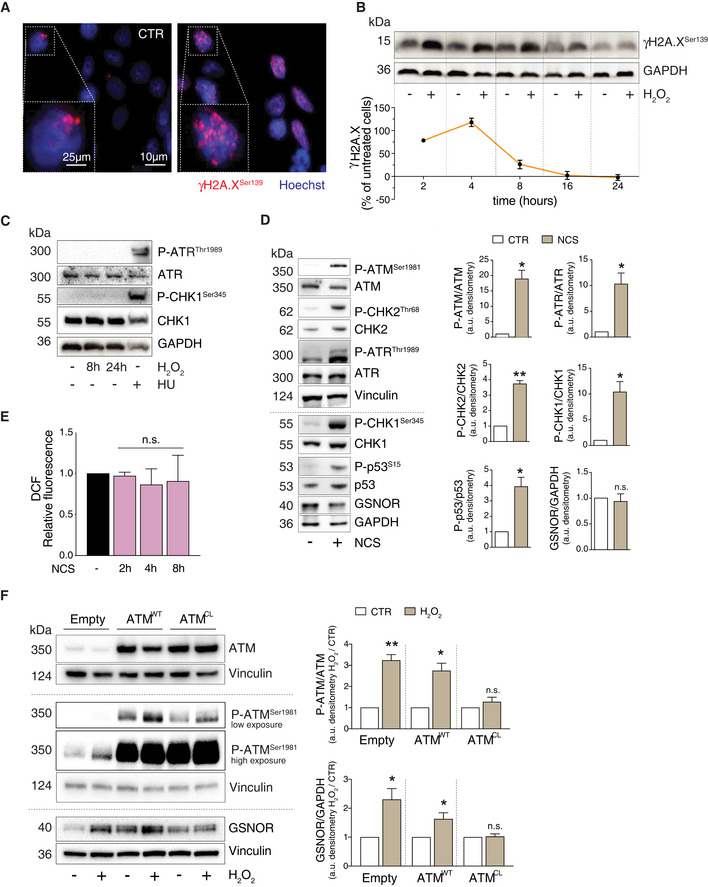
Figure 3. GSNOR induction by hydrogen peroxide is dependent on the redox activation of ATM and kept sustained over time.

-
AHEK293 cells treated for 4 h with 100 μM H2O2. Phospho‐histone H2A.X (γH2A.X) was assessed by immunofluorescence analysis. Nuclei (blue) were stained with Hoechst 33342. Scale bar: 10 μM. 4X digital magnification is shown at the bottom left of each image. CTR: H2O2‐untreated cells.
-
BAdditionally, γH2A.X was also assessed by Western blot at the indicated time points. GAPDH was used as loading control (top panel). Densitometry of each lane intensity is normalized to GAPDH, selected as loading control, and expressed as % of γH2A.X in H2O2‐treated versus untreated cells. Values represent the means ± SD of two independent experiments (bottom panel).
-
CHEK293 cells were treated for 8 or 24 h with 100 μM H2O2 or, alternatively, for 2 h with 2 mM hydroxyurea (HU), selected as positive control of ATR/CHK1 axis activation. Basal and phospho‐active forms of ATR and CHK1 (at Ser345) were assessed by Western blot. GAPDH was used as loading control.
-
DHEK293 cells were treated for 8 h with 20 μM neocarzinostatin (NCS). (left) Western blot analysis of basal and phospho‐active forms of ATM, CHK2, ATR, CHK1, p53, and GSNOR in HEK293 cells treated for 8 h with 20 μM neocarzinostatin (NCS). Vinculin and GAPDH were used as loading controls. (right) Phospho:basal level ratios of ATM, CHK2, ATR, and CHK1, along with densitometry of GSNOR immunoreactive bands are expressed as arbitrary units. Values shown represent the means ± SD of n = 3 independent experiments. *P < 0.05; **P < 0.01; n.s., not significant.
-
EHEK293 cells were treated for 2, 4 and 8 h with 20 μM neocarzinostatin (NCS). After treatment, cells were incubated with 2’,7’‐H2DCF‐DA to cytofluorometrically assess the intracellular production of H2O2. Values are shown as units of DCF fluorescence relative to untreated cells. Values are shown as units of fluorescence relative to NCS‐untreated cells (arbitrarily set as 1) and represent the means ± SD of n = 3 independent experiments. n.s., not significant.
-
FHEK293 cells were transfected with plasmids coding for the wild‐type (WT), C2991L redox mutant (CL) of ATM, or with an empty vector (Empty; used as negative control) for 40 h and treated for additional 8 h with 100 μM H2O2. Basal and phospho‐active forms of ATM and GSNOR were assessed by Western blot analysis. Vinculin and GAPDH were used as loading controls. Two different exposures (low and high) were selected to highlight differences in P‐ATM levels in different experimental settings. Phospho:basal level ratios of ATM, along with densitometry of GSNOR immunoreactive bands are expressed as arbitrary units relative untreated cells. Values shown represent the means ± SD of n = 3 independent experiments. *P < 0.05; **P < 0.01; n.s., not significant.
Source data are available online for this figure.
