-
A–D
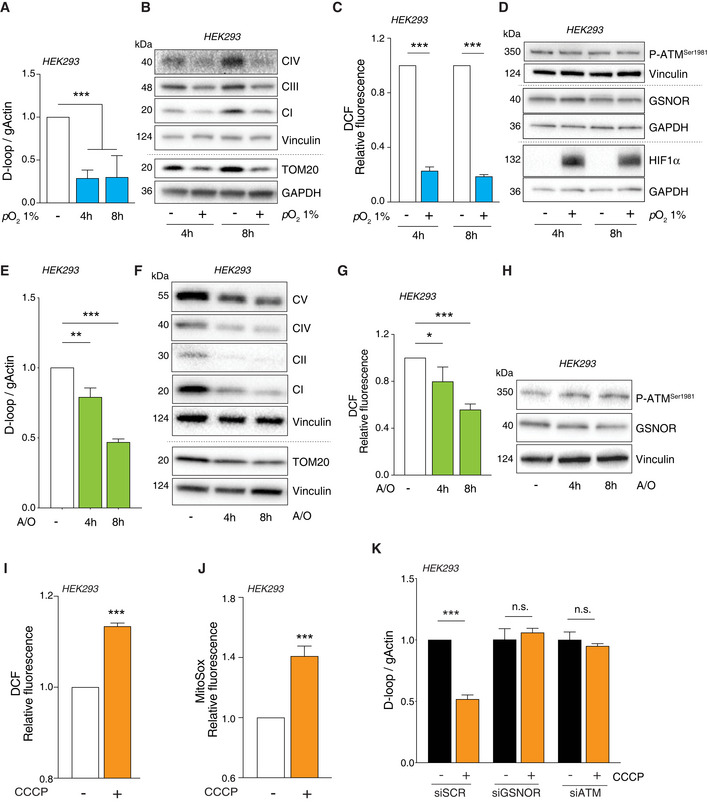
HEK293 cells were subjected to hypoxia (i.e., pO2 = 1%) for 4 and 8 h. (A) Mitophagy was assayed by RT–qPCR relative quantitation of D‐loop (selected as measure of mtDNA). Results shown are the means ± SD of n = 6 independent experiments. ***P < 0.001 calculated with respect to cells kept in normoxic conditions. (B) Mitophagy was also evaluated by Western blot of TOM20 and different mitochondrial complex subunits, i.e., NDUFB8 (CI), SDHB (CII), and MTCO2 (complex IV). Vinculin and GAPDH were used as loading controls. (C) After treatment, cells were incubated with 2’,7’‐H2DCF‐DA to cytofluorometrically assess the intracellular production of H2O2. Values are shown as units of DCF fluorescence relative to cells maintained in normoxic conditions (arbitrarily set as 1) and represent the means ± SD of n = 3 independent experiments. ***P < 0.001. (D) Western blot analysis of phospho‐ATM and GSNOR. HIF1α was selected as marker of hypoxia. Vinculin and GAPDH were used as loading controls.
-
E–H
HEK293 cells were treated for 4 and 8 h with 1 μM of a combination of oligomycin and antimycin. Mitophagy was evaluated by (E) D‐loop quantitation as described in panel A. Results shown represent the means ± SD of n = 3 independent experiments. **P < 0.01 and ***P < 0.001 with respect to untreated cells. (F) Western blot of different mitochondrial proteins (as in panel B). Vinculin was used as loading control. (G) H2O2 production was evaluated cytofluorometrically as described in panel C. Results shown represent the means ± SD of n = 3 independent experiments. *P < 0.05; ***P < 0.01 with respect to untreated cells. (H) Western blot analysis of phospho‐ATM and GSNOR. Vinculin and GAPDH was used as loading control.
-
I–K
HEK293 cells were treated for 8 h with 10 μM CCCP. After treatment, cells were incubated with 5 μM 2’,7’‐H2DCF‐DA (I) or MitoSox (J) to evaluate the production of H2O2 or mitochondrial superoxide, respectively. Values are shown as units of DCF or MitoSox fluorescence relative to untreated cells (arbitrarily set as 1) and represent the means ± SEM (I) or SD (J) of n = 3 independent experiments. ***P < 0.001 with respect to untreated cells. (K) Before CCCP treatment, cells were transfected for 48 h with siRNA against ATM (siATM), GSNOR (siGSNOR), or control siRNA (scramble, siScr). Mitophagy was assessed by RT–qPCR relative quantitation of D‐loop. Results shown are the means ± SD of n = 3 experiments run in triplicate. ***P < 0.001; n.s., not significant, calculated with regard to untreated cells.

