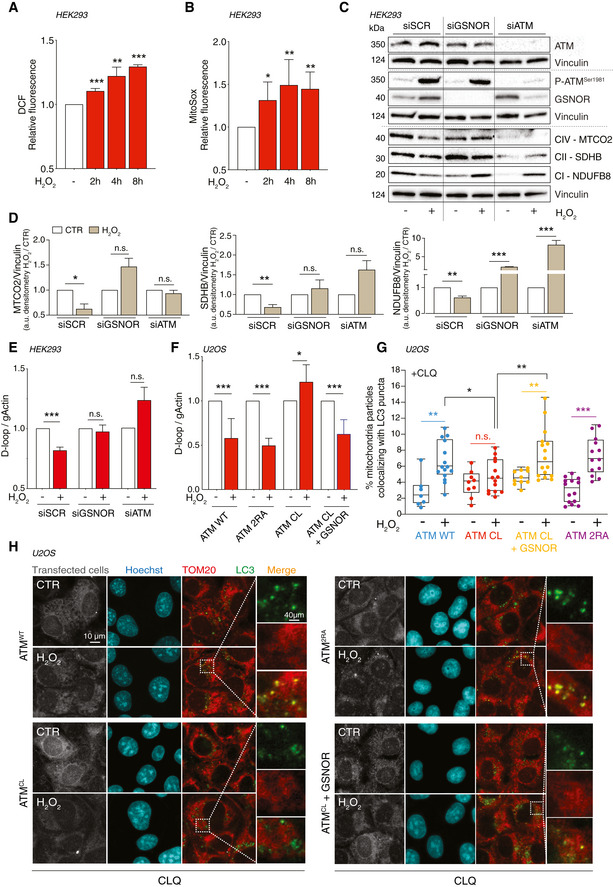
Figure 5. ATM/GSNOR axis drives mitophagy upon H2O2 treatment.

-
A, BHEK293 cells treated for 2, 4, and 8 h with 100 μM H2O2. After treatment, cells were incubated with 5 μM 2’,7’‐H2DCF‐DA (A) or MitoSox (B) to evaluate the production of H2O2 or mitochondrial superoxide, respectively. Values are shown as units of DCF or MitoSox fluorescence relative to untreated cells (arbitrarily set as 1) and represent the means ± SD of n ≥ 3 independent experiments. *P < 0.05; **P < 0.01; ***P < 0.001.
-
CHEK293 was transfected for 48 h with siRNA against ATM (siATM), GSNOR (siGSNOR), or control siRNA (scramble, siScr). Afterward, they were treated for 8 h with 100 μM H2O2 and mitophagy was assessed by Western blot of different mitochondrial complex subunits [i.e., NDUFB8 (complex I), SDHB (complex II), and MTCO2 (complex IV)]. Basal and phospho‐ATM and GSNOR were used to check the efficiency of siRNA‐mediated knockdown. Vinculin was used as loading control.
-
DDensitometry of mitochondrial protein immunoreactive bands of panel C (normalized to Vinculin) is indicated as H2O2‐treated versus untreated cells (CTR) and expressed as arbitrary units. Values shown represent the means ± SD of n = 3 independent experiments. *P < 0.05; **P < 0.01; ***P < 0.001; n.s., not significant.
-
EIn the same experimental settings, mitophagy was also assessed by RT–qPCR relative quantitation of D‐loop (selected as measure of mtDNA) normalized to genomic actin (gActin). Results shown are the means ± SD of n = 8 experiments ***P < 0.001; n.s., not significant.
-
FU2OS cells were depleted of endogenous ATM by repeated transfections with shRNA and induced, by doxycycline incubation, to express ATMWT, ATM2RA, or ATMCL mutant. Where indicated, cells were further transfected with a GSNOR‐coding vector and then treated for 4 h with 100 μM H2O2. Mitophagy was assessed by RT–qPCR relative quantitation of D‐loop normalized to genomic actin (gActin). Results shown are the means ± SD of n = 6 experiments. *P < 0.05; ***P < 0.001.
-
G, HIn the same experimental settings, mitophagy was also assessed at 8 h by fluorescence microscopy analyses upon incubation with chloroquine (CLQ) to enhance differences in mitophagy. Anti‐TOM20 (red) was used to visualize mitochondria; anti‐LC3 (green) was used to identify autophagosomes. Percentage of mitochondria merging with LC3‐positive puncta calculated by Fiji analysis software using the open‐source plugin ComDet v. 0.3.7. Values are expressed as % of mitochondria (TOM20+ particles) co‐localizing with LC3/cell and graphed as boxes (25th‐75th interquartile range) and whiskers (minimum to maximum showing all points), with central bands representing the median of n ≥ 7 different cells analyzed. *P < 0.05; **P < 0.01; ***P < 0.001.
Source data are available online for this figure.
