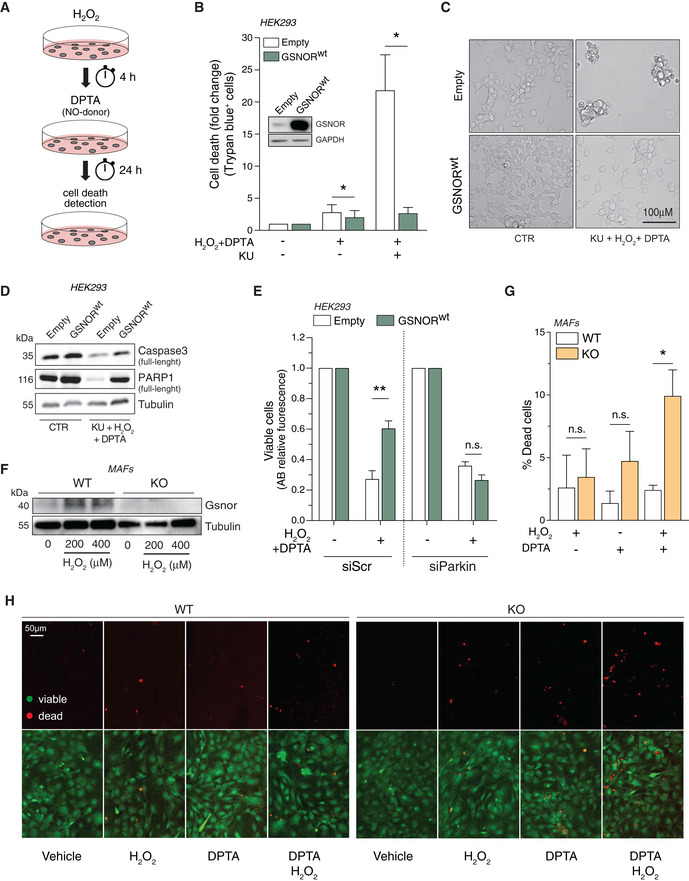
Figure 7. Redox activation of ATM/GSNOR axis is required to counteract nitroxidative stress‐induced cell death.

-
AScheme of the protocol designed for the combined treatment of HEK293 cells with H2O2 and DPTA.
-
BHEK293 cells overexpressing the wild‐type form of GSNOR (GSNORwt) or an empty vector (Empty) were subjected to combined treatment (200 μM H2O2 + 400 μM DPTA) in the presence or absence of the ATM inhibitor KU55933 (KU). Analysis of dead cells was performed with Trypan blue exclusion assay. Western blot analysis of GSNOR is shown as inset in the graph to substantiate transfection efficiency. Data, shown as fold change of dead cells relative to untreated cells (arbitrarily set to 1), represent the mean count ± SEM of n = 4 experiments done in duplicate *P < 0.05; with respect to Empty cells.
-
CRepresentative optic microscopy image of GSNORwt and empty cells upon 24‐h treatment with H2O2 + DPTA in the presence KU.
-
DWestern blot analysis of caspase3 and PARP1 in GSNORwt and empty cells treated as in panel C. Tubulin was used as loading control.
-
EHEK293 cells overexpressing the wild‐type form of GSNOR (GSNORwt) or an empty vector (Empty) were transfected with siRNA against Pakin (siParkin) or control siRNA (scramble, siScr). Afterward, they were subjected to combined treatment (200 μM H2O2 + 400 μM DPTA) and viability assessed by Alamar blue (AB) fluorescent assay. Data, shown as fold change of viable cells, refer to AB fluorescence (relative to untreated cells, arbitrarily set to 1) and represent the means ± SD of n = 6 independent experiments. **P < 0.01; n.s., not significant.
-
FWestern blot of Gsnor was assessed in mouse adult fibroblasts (MAFs), obtained from wild‐type (WT) and Gsnor‐null (KO) mice treated with 200 or 400 μM H2O2 for 24 h.
-
G, HWT and Gsnor‐null MAFs were subjected to treatment with 200 μM H2O2, or 400 μM DPTA, or a combination of both. Cell viability was evaluated by LIVE/DEAD assay. Scale bar = 50 µm. Data, shown as % of dead (red) cells, represent the mean count ± SD of n = 3 different fields of three independent experiments. *P < 0.05; n.s., not significant with respect to WT MAFs.
Source data are available online for this figure.
