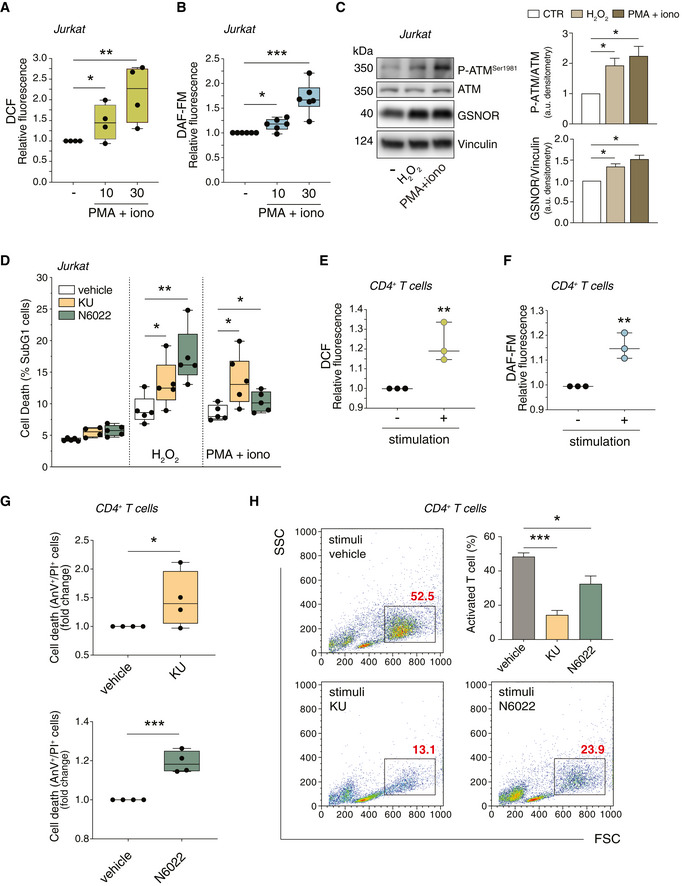
Figure 8. Role of ATM and GSNOR in T‐cell activation.

-
A, BJurkat cells were treated for 10 and 30 min with PMA (200 ng/ml) and ionomycin (iono; 300 ng/ml). After treatment, cells were incubated with 5 μM 2’,7’‐H2DCF‐DA (A) or DAF‐FM‐DA (B) to evaluate the production of H2O2 or NO, respectively. Values are expressed as units of DCF or DAF‐FM fluorescence relative to untreated cells (arbitrarily set as 1) and graphed as boxes (25th‐75th interquartile range) and whiskers (minimum to maximum showing all points), with central bands representing the median of n = 4 (A) and n = 6 (B) independent experiments. *P < 0.01; **P < 0.001; ***P < 0.001.
-
C(left) Jurkat cells were treated for 24 h with H2O2 (50 μM) or PMA/ionomycin (200 + 300 ng/ml). Basal and phospho‐active form of ATM, and GSNOR were assessed by Western blot. Vinculin was used as loading control. (right) Phospho:basal level ratios of ATM along with densitometry of GSNOR immunoreactive bands are expressed as arbitrary units. Values shown represent the means ± SD of n = 3 independent experiments. *P < 0.05.
-
DJurkat cells were treated for 24 h with H2O2 (50 μM) or PMA/ionomycin (200 + 300 ng/ml), in the presence or absence of ATM inhibitor (KU55933; 5 μM) or GSNOR inhibitor (N6022; 25 μM). Cell death was assessed cytofluorimetrically upon staining with propidium iodide (PI). Values are expressed as % of sub‐G1 population of PI‐stained cells and graphed as boxes (25th‐75th interquartile range) and whiskers (minimum to maximum showing all points), with central bands representing the median of n = 5 independent experiments. *P < 0.05; **P < 0.01.
-
E, FCD4+ T cells were incubated for 30 min with anti‐CD3, anti‐CD28 and anti‐CD49d (stimulation). After stimulation, cells were incubated with 5 μM 2’,7’‐H2DCF‐DA (E) or DAF‐FM‐DA (F) to fluorometrically evaluate the production of H2O2 or NO, respectively. Values are shown as units of DCF or DAF‐FM fluorescence relative to non‐stimulated cells (arbitrarily set as 1). Values are shown as fold change and represent the median plus range with all the experimental points of n = 3 independent experiments. **P < 0.01.
-
GCD4+ T cells were stimulated for 96 h with anti‐CD3, anti‐CD28 and anti‐CD49d in the presence or absence of ATM inhibitor (KU, upper panel) or GSNOR inhibitor (N6022, bottom panel). Cell death was assessed cytofluorometrically upon staining with Annexin V (AnV) and PI. Values are expressed as fold change of AnV+/PI+ cells relative to control (CD4+ without inhibitor, vehicle, arbitrarily set to 1) and graphed as boxes (25th‐75th interquartile range) and whiskers (minimum to maximum showing all points), with central bands representing the median of n = 4 independent experiments. *P < 0.05; ***P < 0.001.
-
HIn the same experimental settings, populations of stimulated (proliferating) CD4+ T cells were identified cytofluorometrically and included in rectangles. Values (as % of total population) are shown in red in each representative plot identify and summed up in a graph as the means ± SD of n = 3 independent experiments. *P < 0.05; ***P < 0.001.
Source data are available online for this figure.
