
Figure EV5. Mitochondrial altFUS mutants potentiates TDP‐43 cytoplasmic aggregates.
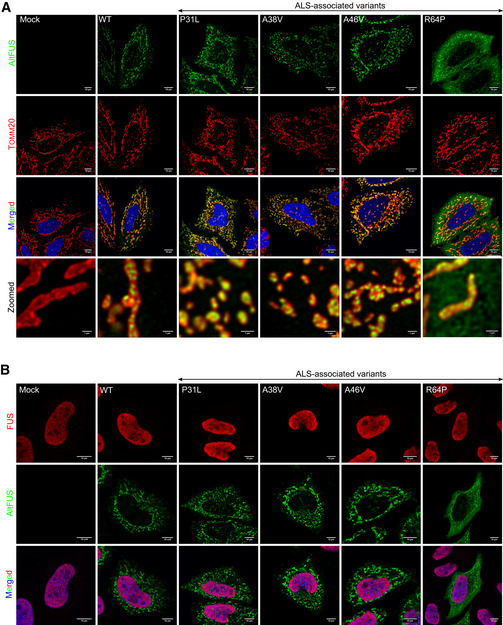
- Images by confocal microscopy of altFUS (FLAG‐tagged—green) and mitochondria (Tomm20 marker, red) in HeLa cells over‐expressing the empty vector (mock), altFUS‐Flag, altFUS‐P31L‐Flag, altFUS‐A38V‐Flag, altFUS‐A46V‐Flag or altFUS‐R64P‐Flag constructs (representative images from n = 3). The white scale bar corresponds to 10 μm. Deconvolution over a maximum of 30 iterations on the green and red channels was performed for the zoomed in pictures. The white scale bar corresponds to 1 μm.
- Images by confocal microscopy of endogenous FUS (red) and altFUS (Flag‐tagged—green) in HeLa cells over‐expressing the empty vector (mock), altFUS‐Flag, altFUS‐P31L‐Flag, altFUS‐A38V‐Flag, altFUS‐A46V‐Flag or altFUS‐R64P‐Flag constructs (representative images from n = 3). The white scale bar corresponds to 10 μm.